What makes people happy?

The ultimate goal for each and everyone of us is to be happy and live a happy life, and to do so everyone has his own definition of happiness and his own way of achieving happiness as every person is unique in his own way. However, there are many common factors that influence how happy a person can be. In this analysis we determine what are the these common factors and answer questions such as where do the happiest people live? and are we becoming happier with time?
The analysis is based on the world happiness report which is an annual publication of the United Nations Sustainable Development Solutions Network. It contains rankings of national happiness based on respondent ratings of their own lives, which the report also correlates with various life factors such as GDP per capita, Social support, Healthy life expectancy , Freedom to make life choices, generosity and perceptions of corruption
1- What are the factors that affects our happiness?
The first step to understand how the different variables affect our happiness is to visualize the correlation heatmap and find out the variables that highly correlates with the happiness score
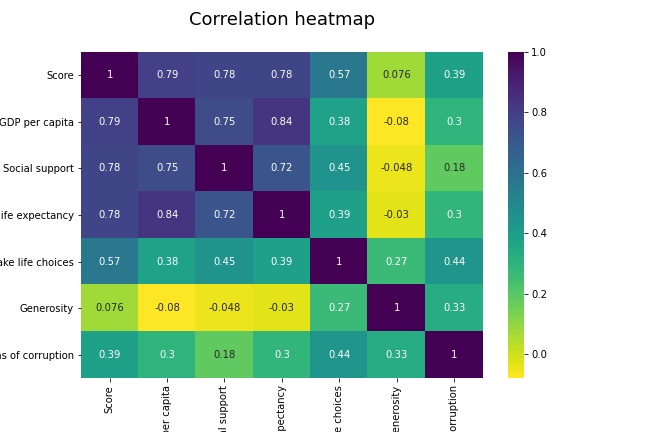
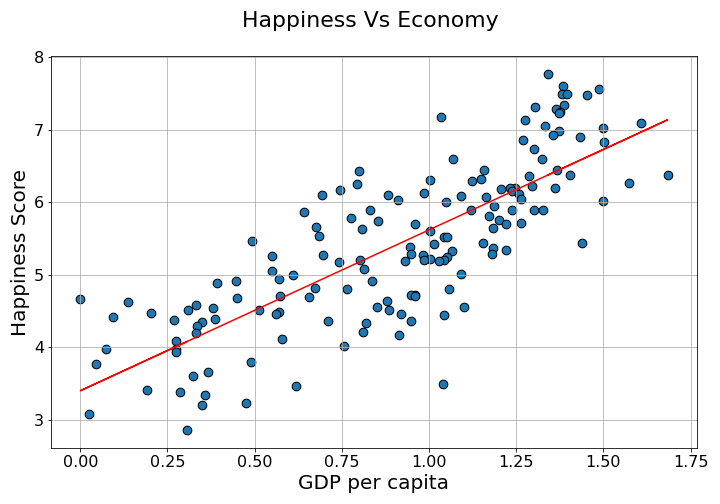
The heatmap indicates that there are 3 variables that highly correlates with happiness score : GDP per capita 0.79 , Social support 0.78 and Healthy life expectancy 0.78. Freedom to make life choices also impacts happiness with a 0.57 correlation. Correlation being a value between -1 and 1, the closer the correlation is to + or -1 the more correlated the two variables are (positively or negatively). while a value close to 0 indicates little or no correlation between the two variables
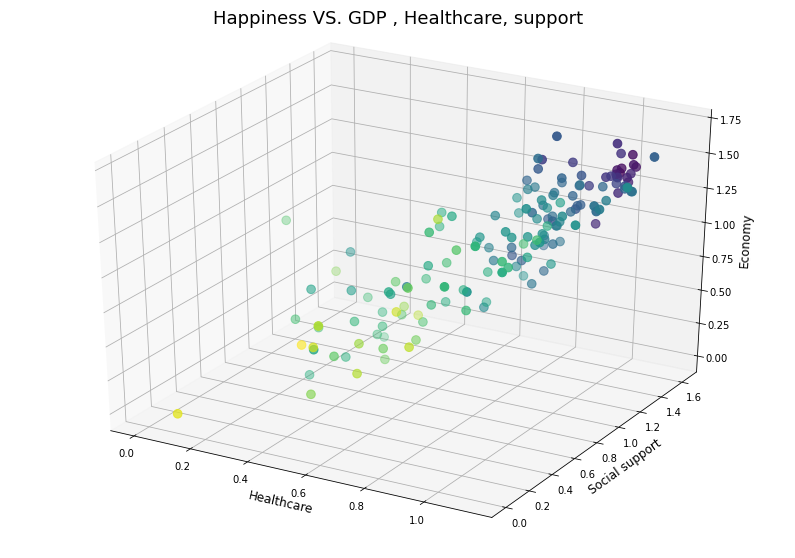
It can also be noted that the three variables that are highly correlated with happiness score are also highly correlated with each other which is logical that a country with a good economy (GDP per capita ) also has a good health care system (Healthy life expectancy) and offers its citizens a good social support. with a 3D scatter plot of these three variables and the points being colored based on the happiness score (the darker the color going from yellow ,green , blue, purple the higher the score). It becomes clear that the higher these three values are the higher the happiness score.
Happiness score is a real number between 0 and 10, the higher the score the happier.
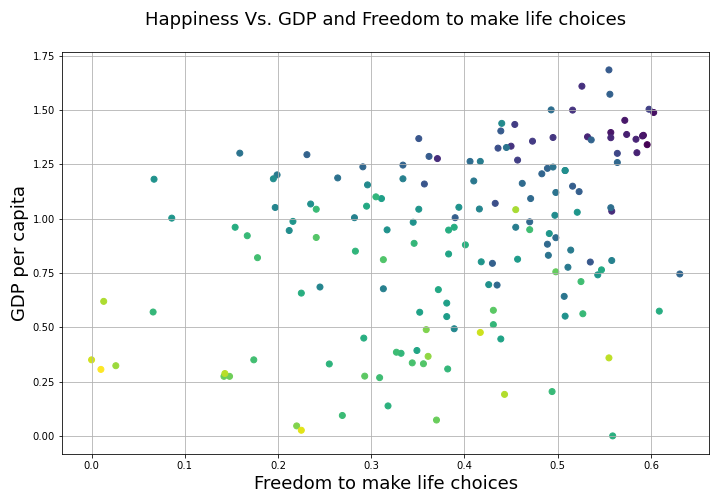
It is also useful to see how Freedom to make life choices affects the happiness score, in Figure 3 a scatter plot, have both GDP per capita and freedom to make life choices and again the dots color indicates the happiness score. (The choice of GDP per capita is based on the fact that it is highly correlated with the 2 other variables Life expectancy and social support and therefore they are the same and we can represent them with only one of the variables, GDP being a little more correlated with Happiness score, is chosen). The plot shows that although higher GDP indicates happier people , Combining it with freedom to make life choices gives you the happiest people.
Now we know what the factors that affects happiness are; a good economy, social support, a good health care system and freedom to make life choices. The next step is to explore where do the happiest people live?
2- Where do the happiest people live?
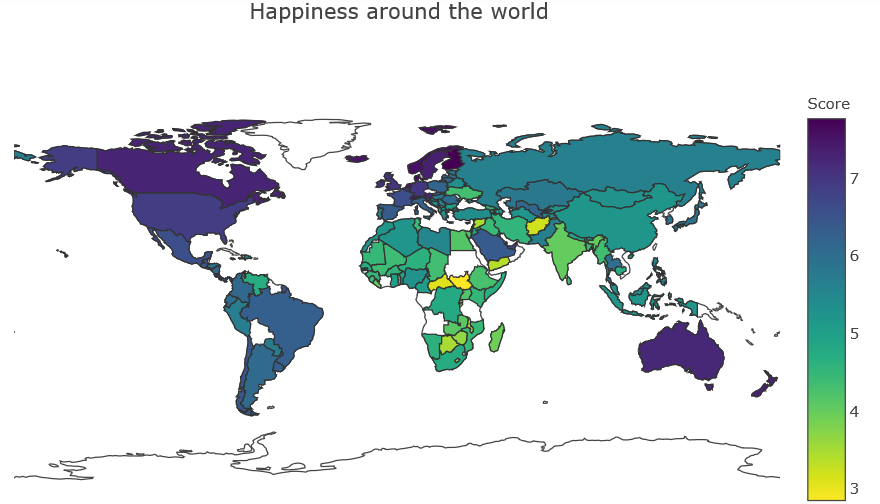
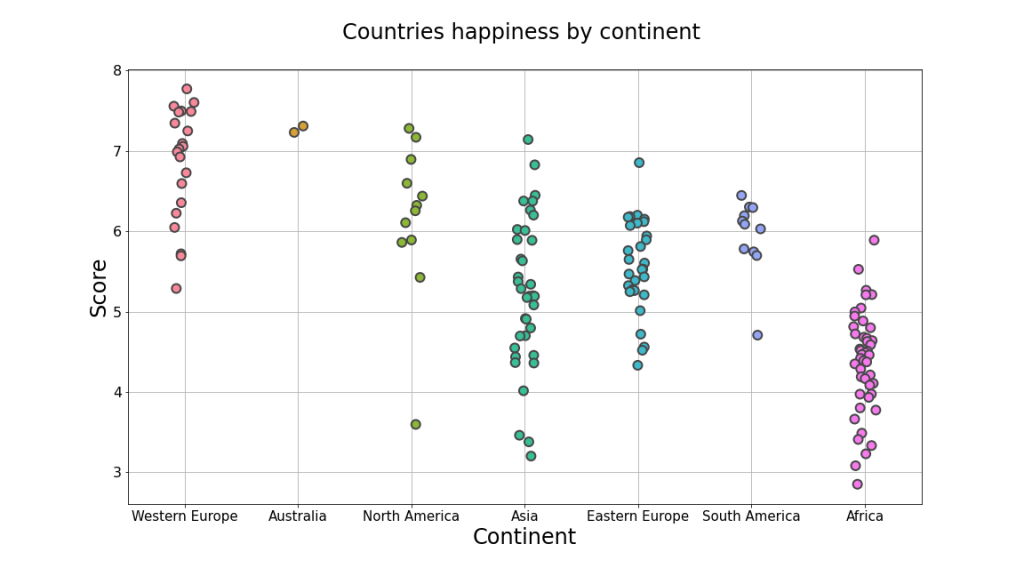
A look at happiness score based on continents we determine that the happiest countries are located in western Europe followed by Australia/New Zealand and North America. Asia shows a high discrepancy as they have a number of happy countries and an almost equal number of unhappy countries. While Africa seems to have the unhappiest countries in the world.
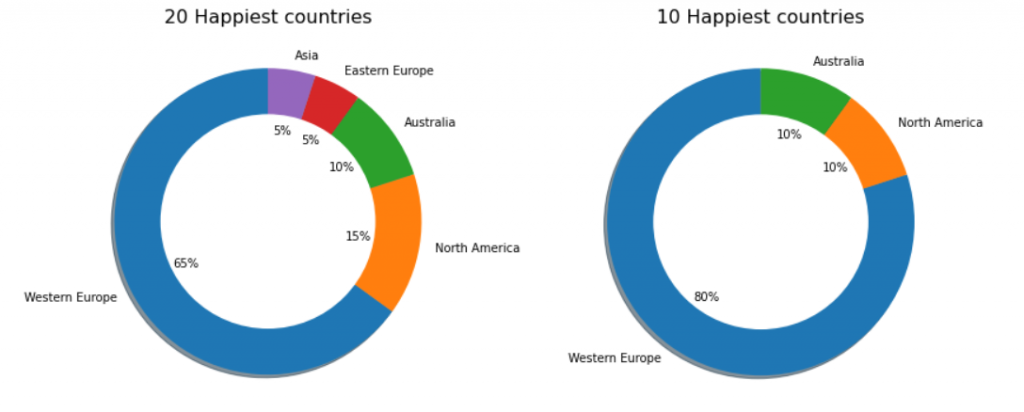
As for the top 20 happiness scores for countries, 13 out of 20 are from western Europe (65%) , and out of the top 10 , 8 of them are from western Europe (80%) . It seems like governments in western Europe are managing their countries the right way providing their citizens with all what is needed for them to follow their dreams and live a fulfilling life.
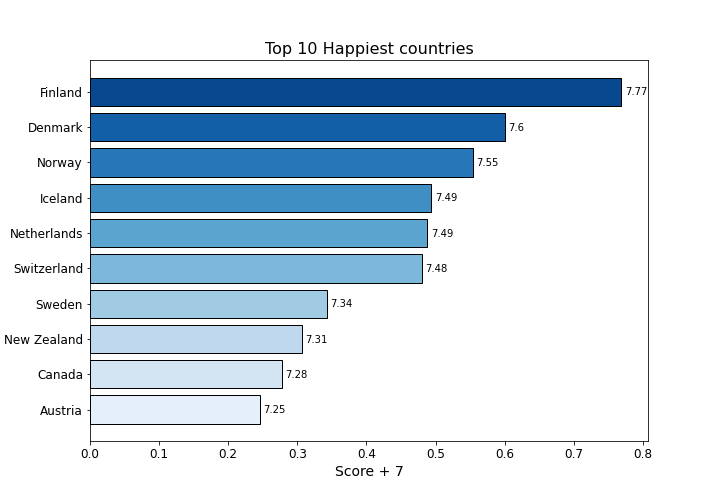
As for individual countries that made the top happy countries, Finland finished first followed by Norway and Iceland. New Zealand and Canada are the only two countries that made the top 10 outside of western Europe finishing 8th and 9th respectively.
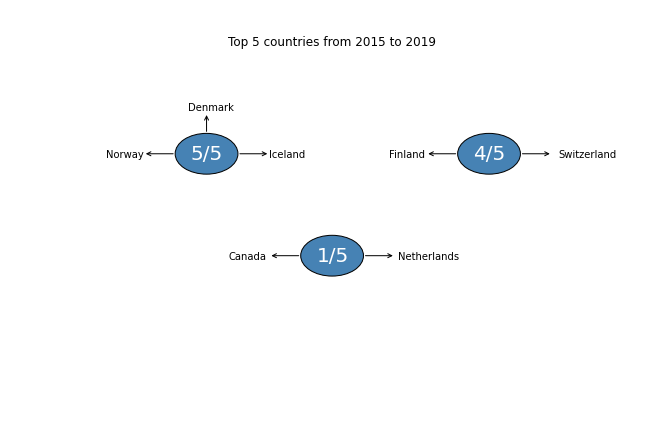
Between 2015 and 2019; three countries cracked the top 5 in happiness every year (Denmark, Iceland, Norway) and two countries only missed the top 5 once (Finland and Switzerland). while Canada and Netherlands where able to enter the top 5 once.
Now we have a clear idea where the happiest places are located in. The final step is to determine whether we are getting happier with time or not.
3- Are we getting happier?
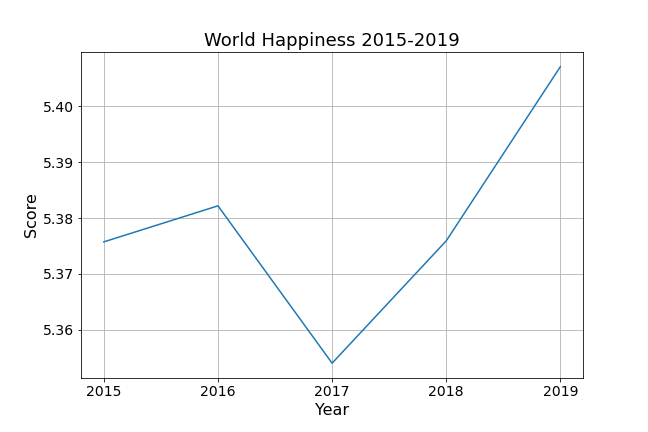
Between 2015 and 2019, The overall happiness of the world increased every year with the exception of 2017. And overall happiness increased from 5.375 in 2015 to 5.407 in 2019
What about 2020?
In order to make a forecast for next year’s overall happiness score, the best way to do it in our case is to use a linear regression model, the best linear model based on statistical significance is the model that makes happiness prediction based on the GDP per capita. With Covid-19 outbreak in 2020, many fear of an economic collapse and a significant drop in GDP per capita due to lockdowns and the absence of economic activities. 2019’s average GDP for all countries was 0.905, we still don’t know how much the average will drop in 2020 but let’s consider a 10% to 20% drop and base our predictions on these two values.
A linear regression model is of the form Y = a*X + b ; in our case Y=Happiness Score and X=GDP the coefficients a and b are determined using the least squares method. Finally our model is: Happiness score = 2.22*GDP + 3.4 [1]. For example a country with GDP equal to 1 , we can make a prediction of its happiness score by replacing the GDP value in formula [1] and we get a score of 5.62.
2020 forecast: if we consider a GDP drop of 10% in 2020. We get a drop of 3.7% in happiness score from 5.41 in 2019 to 5.2 in 2020 . Similarly if we take the higher value of a 20% drop it would result in approximately 7.4% drop in world happiness. Based on these predictions it seems like 2020 might be a tough year.
Conclusion
In this analysis we determined the factors that influence happiness: a good economy , a good healthcare system and social support from the government while freedom to make life choices is the icing on the cake. As for the countries that provides their citizens with these key factors it looks like western Europe are doing the best job , followed by Australia/New Zealand and North American countries. while Africa is doing the worst job. and while it seems that overall we are getting happier with time, 2020 might be an exception with a slight decrease in overall happiness. However we will definitely bounce back and trend upwards again.