To begin with this topic, I would like to point out that suicide is a very serious matter that affects every family in the world, and should not be taken lightly under any circumstances.
Introduction
This project was based on one question: why would people decide to commit suicide? My hypothesis is that for some people, life gets tough and they find that there is no way out of it other than to take their own life. Sometimes, the pressures of life are overwhelming to the point where a person sees no end in sight.
To help get an idea of this issue, I used a database uploaded to Kaggle.com that includes metrics from most countries in the world, including suicide numbers and suicide rates between 1989 and 2016. The data is spliced into different age groups and categorized by country.
Tool
For this project, the tool used was Tableau, which is a fairly simple software to use and provides a lot of features. Tableau is as easy as importing the dataset, pressing a few buttons and exporting graphics to illustrate the data and visualize its significance.
General Overview
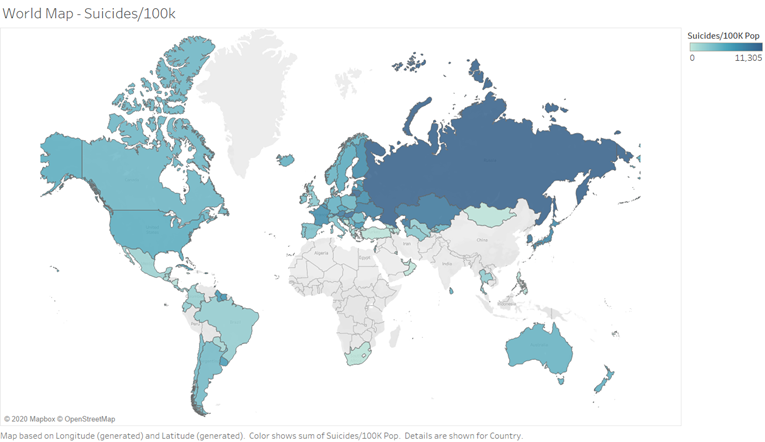
The map above shows the suicide rates per 100,000 people in every country in the database. The darker the blue color, the higher the suicide rate. We can infer from this map that Russia has the highest suicide rate of all the countries, shortly followed by Lithuania.
Of course, graphic does not show the big picture, so let’s look at the raw number of suicides per country.
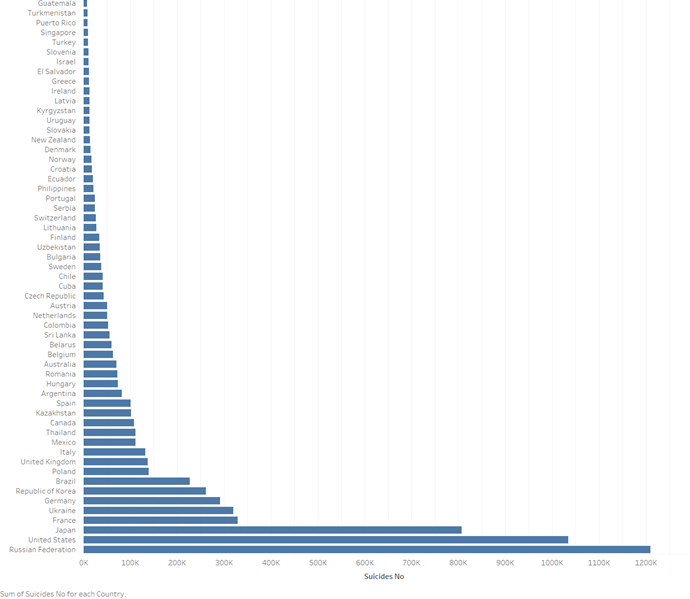
In the graphic above, we can confirm that Russia has the highest number of suicide numbers between 1989 and 2016, having a total of 1,200,000 suicide cases between the two years. Russia is followed directly by the United States of America (USA) with around 1,050,000 cases between 1989 and 2016.
Those numbers might suggest that the USA have a high suicide rate, but this graph only shows raw numbers. To get a better idea, we check the number of cases per 100,000 people. This provides a normalization of our data and an objective point of view for each country.
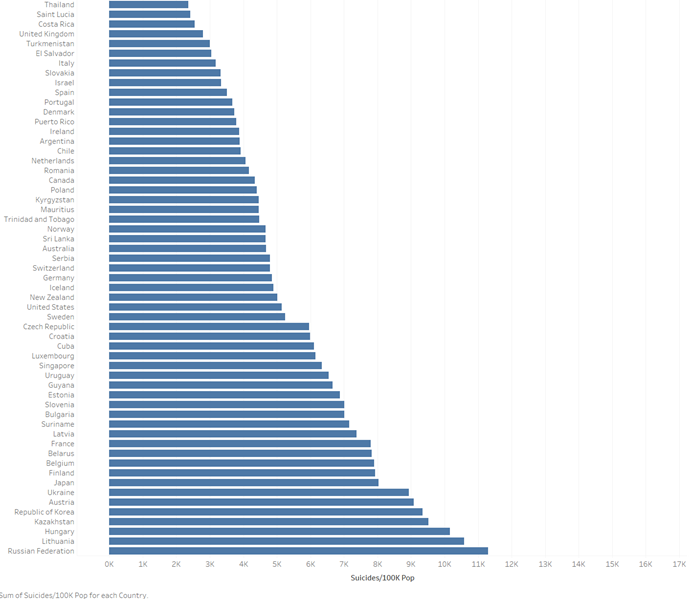
In the graph above, we can confirm our observation from our heat map, as well as negate the hypothesis that the USA has a high suicide rate. In fact, the USA’s suicide rate is not even in the top ten!
We see that Russia, Lithuania, Hungary, Kazakhstan and the Republic of Korea (South Korea) have the highest suicide rates of all the countries in the database.
Analysis of the Top Five Highest Suicide Rates.
For this section, we will refer to the number of suicide cases, rather than the suicide rate. We will also divide our time period into two sections; from 1995 to 2005, and from 2006 to 2016
For a comprehensive analysis, we considered the data starting from 1995 due to some countries not having registered data before that year.
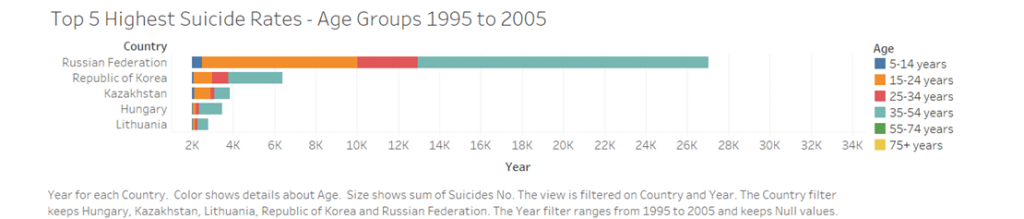
In the graphic above, we can see that in all the countries considered, the largest number of suicide cases are between the ages of 35 and 54, and the second largest number is for the adolescents and young adults at the time.
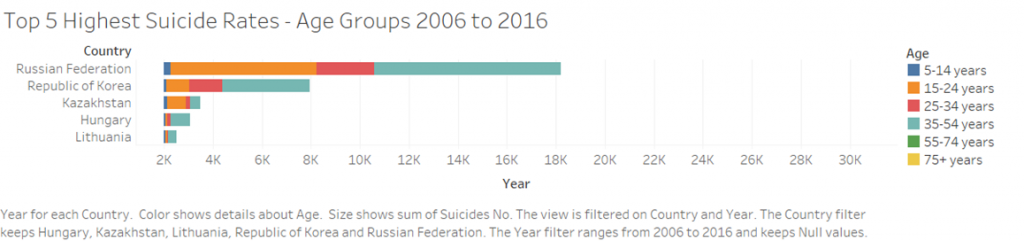
For the years between 2006 and 2016, we see a similar trend.
The largest number of suicide cases are aged between 35 and 54. This might suggest that it is the effect of a midlife crisis, further supporting my hypothesis that suicide is the result of the pressures of life on a person.
The adolescent cases might be due to the same reason. The countries considered were not particularly liberal during the period the data was submitted. Those numbers might be due to parental pressure, as well as school and college pressure on students.
In-Depth Look at Russia
In this section, we will discuss some of the trends in Russia concerning suicide numbers. We will take a look at how the numbers evolved between 1989 and 2015.
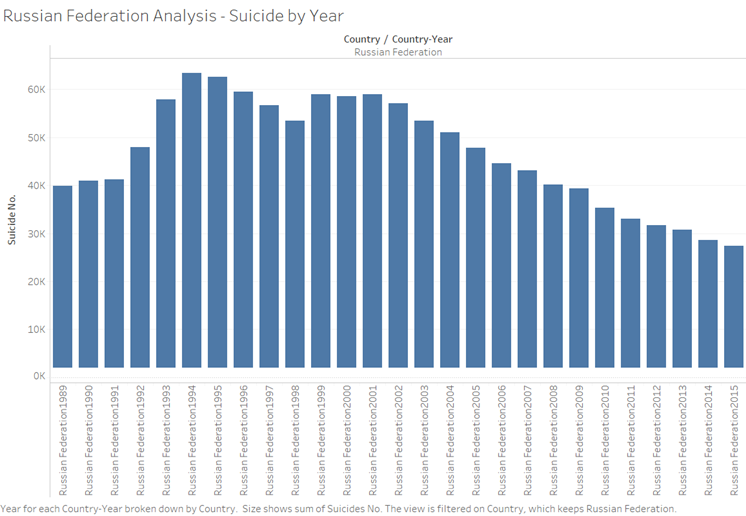
Using the chart above, we can see that between 1989 and 1994, suicide cases were on an increasing trend, reaching a peak of 65,000 cases in 1994. Starting 1995, suicide cases began to drop, with a spike between 1999 and 2001, reaching a high of around 60,000 cases in 2001. Afterward, the downward trend becomes significantly clearer, dropping in to around half of the number in 2001 in 14 years.
For a more in-depth analysis, we will divide the population into the two sex groups: males and females.

Using the chart above, we can clearly see that there is a much higher number of male cases than female cases, almost three times as many, or more in some years. We can also notice that the curve for the female cases is much flatter than the curve for the male cases between 1989 and 2015.
Conclusion
Our results do suggest that suicide might be an effect of a midlife crisis, especially considering that the society during the time period considered was reliant on a primarily male workforce. The effects of a midlife crisis would affect the males more than the females under those circumstances. This would explain why there is a more consistent number of female cases in Russia, for example. This is in no way an excuse for supporting a predominantly male workforce regardless. I felt that it needed to be pointed out.
I would like to repeat my opening statement that suicide is not something to be taken lightly, and should be dealt with with extreme caution and compassion. Never be afraid to talk to a therapist, or someone you trust, if you are having suicidal thoughts.
Lebanese Suicide Hotline: 1564
