Data Source: The ATP official website
Tools : Python 3.7 (Plotly Library)
Tennis has always been an intriguing and fabulous sport. Played on three different surfaces and with so many different styles, it has created a special kind of entertainment you cannot see elsewhere. When two people talk about tennis, you’ll certainly hear them discussing this famous dilemma: Who is the Goat? (Greatest Player of All Time). Is it Federer? Nadal? Djokovic? And opinions usually differ: some arguments are based on straight facts, others on pure feelings and passion (like every other debate in the world). So, to make it easier for people to decide, I’ve chosen a statistical and analytical approach to tackle this problem. From analyzing different playstyles and types of surfaces, to comparing the Big Three with the help of some cool visualization, this article will take you on a beautiful tennis journey where you’ll be able to get a better understanding of the sport, and marvel at the beauty of Data Analytics.
The Battle of the Surfaces
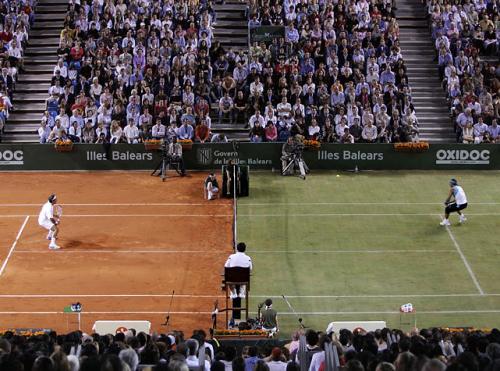
As you may know, tennis is played on three different surfaces: Clay, Grass and Hard Court. What’s the difference between them? And what does this difference really in mean in terms of playstyle? Well, the clay court is considered the slowest surface as it slows down the speed of the ball, thus causing the latter to make a higher bounce. On the flip side, we have the grass court, considered as the fastest due to its slippery surface and very low bounce of the ball. And finally, the standard surface is the hard court, where the ball travels at a speed faster than on clay courts but slower than on grass.
Now, to make this difference more concrete, I first must tell you about aces in tennis. An ace shot is a serve that successfully lands in the opponent’s service box and does not touch his racquet. In other words, he’s not able to return the ball in time. Thus, we can assume that aces are more likely to be hit on grass courts, since the ball on grass has a higher speed. We’ll see if that is really the case.
By
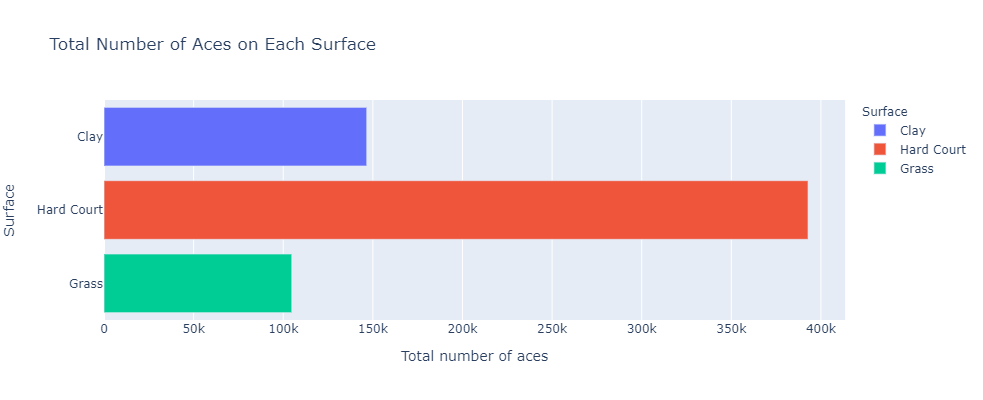
looking at this first bar chart, we realize that the total number of aces hit on
grass is unfortunately the lowest compared to the other surfaces. Lucky for us,
this doesn’t necessarily indicate that our initial assumption is incorrect, but
rather that we’ve chosen the wrong approach to this problem simply because there
are a lot more matches played on hard court than on grass.
So, what is the right way then?
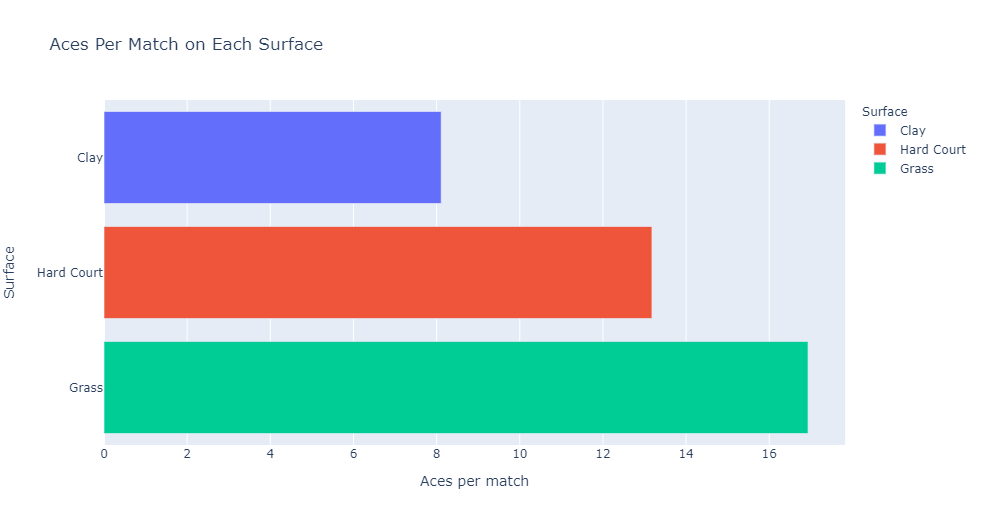
This second bar chart represents the number of aces hit per match (on average) on each surface. The grass court in this case outnumbers clay and hard court in terms of aces. This is a fair comparison, since it takes into consideration what usually happens in one match of tennis.
Here’s another graph for you to further underline the difference between the tennis surfaces:

These are the four biggest tournaments in tennis, they are called grand slams. The Us Open and the Australian Open are played on a hard court, the Roland Garros (French Open) and Wimbledon take place on clay and grass respectively. This scatterplot is a representation of the total number of aces hit per match in each of the grand slams in the year 2010. As you may realize, a point represents one match in a certain grand slam. One specific point grabs all the attention, it’s the last point at the bottom right in Wimbledon: it hints out that more than 120 aces were hit during this match only. It’s a world record yet to be broken, but not only that, it also helps solidifying our famous claim that aces are more likely to be hit on grass.
King of Clay
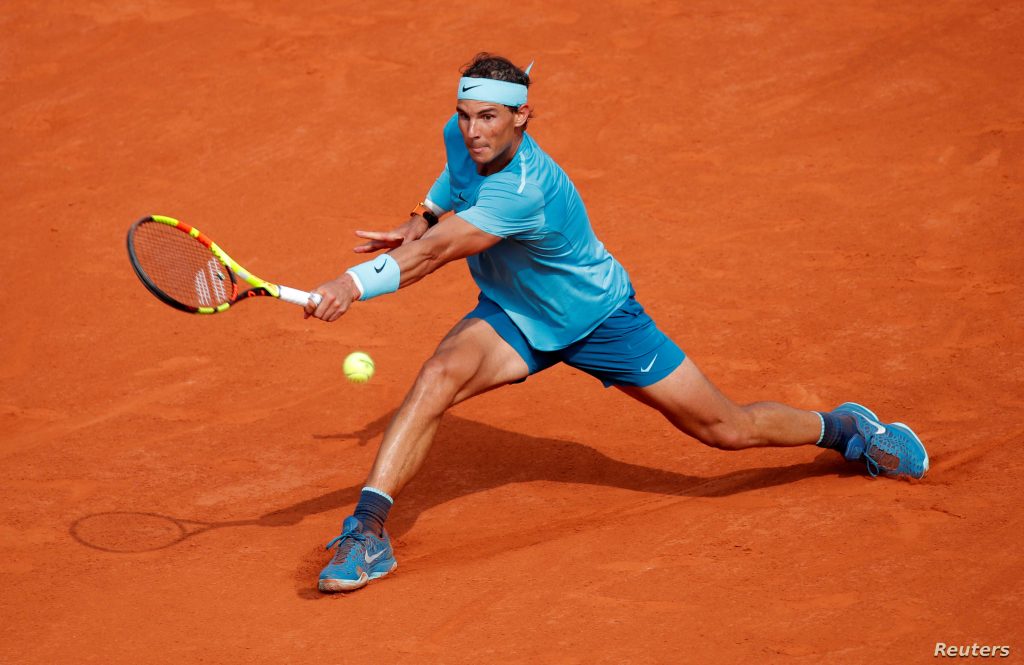
We can’t really
discuss surface differences in tennis without mentioning Rafael Nadal and his
clay court records. He is often nicknamed ‘King of Clay’, we’ll see why in a
second. But let me first reveal to you a secret about his playstyle. Nadal is
known for the huge amount of spin that he puts on the ball with every shot. And
since the bounce of the ball on clay is slower than on other surfaces, he has
the time to put even more spin than usual on the ball and feel very comfortable
during these clay matches thus winning them easily.
The following donut charts will be proof that Nadal is almost unbeatable on
clay and that he indeed earned this nickname.


Now, here are two line-charts showing his performance on clay vs his performance on grass throughout the years.
We can clearly see a huge difference in terms of consistency. The clay line remains somewhat stable as time goes by. However, the grass line is full of ups and downs: grass courts and their slippery surface prevent the Nadal spin to reach its full potential.
Most Successful Countries in Tennis

Each bubble in this
bubble chart represents a country, and the more tennis titles this country has,
the bigger the size of the bubble. If you briefly look at this figure above,
one question may come into your mind: does having more players from the same
country plays a role in increasing its number of titles? Well yes… and no.
Don’t worry, I will use two examples to explain this idea. First, the blue bubble
on the right represents the US. The USA have a lot of players (97) that
contributed together to give their country the second highest number of titles
(126). But wait a minute! The pink bubble in the middle is Switzerland. Switzerland
is ranked third on the title list but has only 18 players. Is this possible? The
answer is yes. Because one swiss player (that is Roger Federer) has carried his
country by winning most of its titles.
Comparing the Big Three
We
spoke a lot about different aspects of the sport, but it’s finally the time to
compare the Big Three: Roger Federer, Rafael Nadal and Novak Djokovic.
Let’s begin with these three radar charts that represent the total number of
aces hit, the total number of double faults made and the total number of break
points saved by the Big Three in 2019.
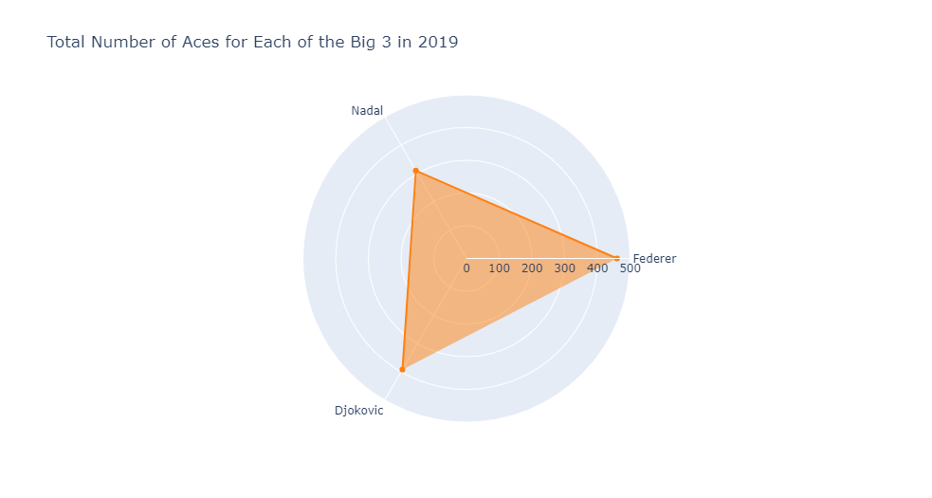
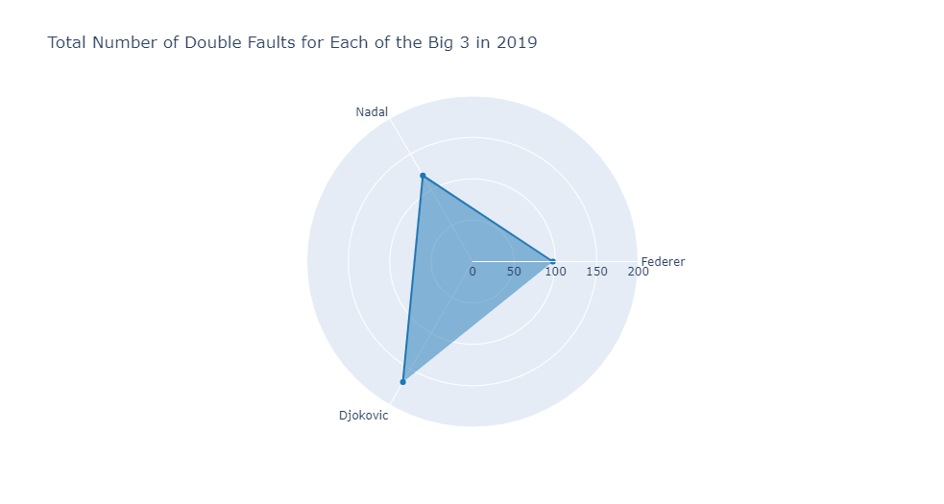
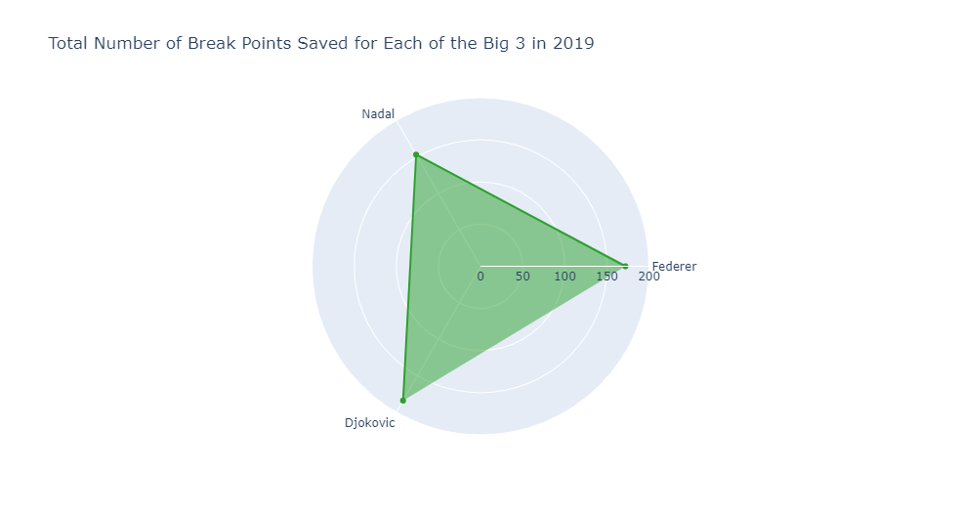
Federer
has a big lead in the first two charts (the less the double faults you make, the
better!) while Djokovic prevails in the third, having a small lead over
Federer.
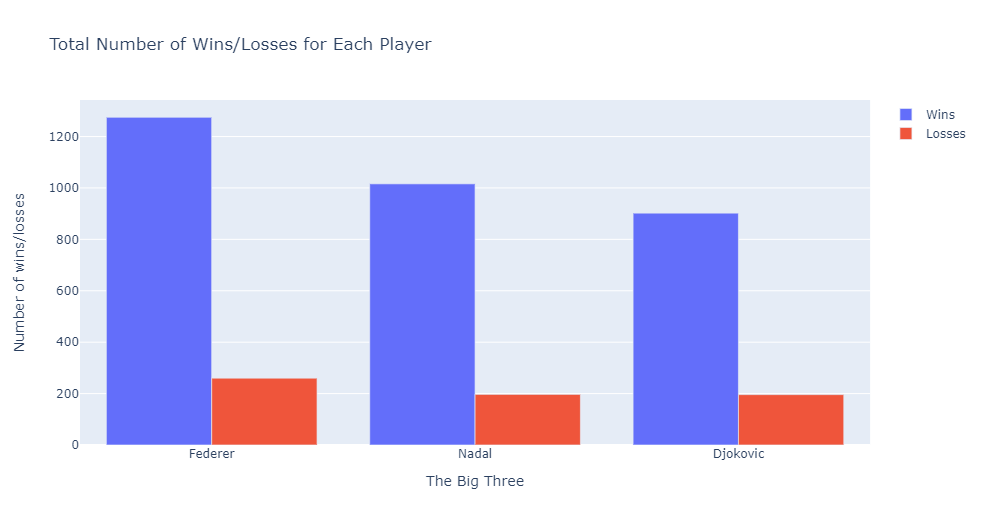

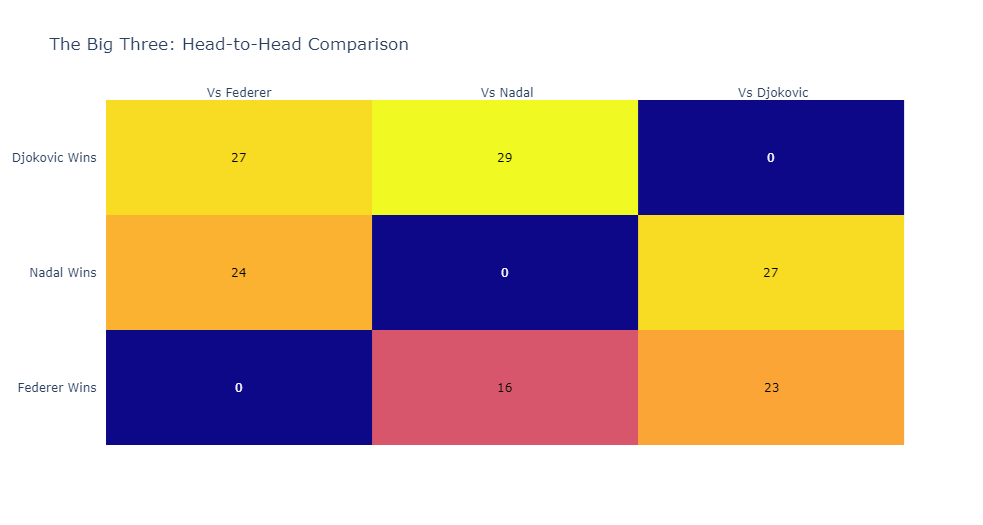
Our final chart is a heat map representing the head-to-head stats for the Big Three against each other. It turns out that so far, Djokovic has a positive score against both of Nadal (D 29 – 27 N) and Federer (D 27 – 23 F) making him the favorite to win the match whenever he faces one of them.
The GOAT
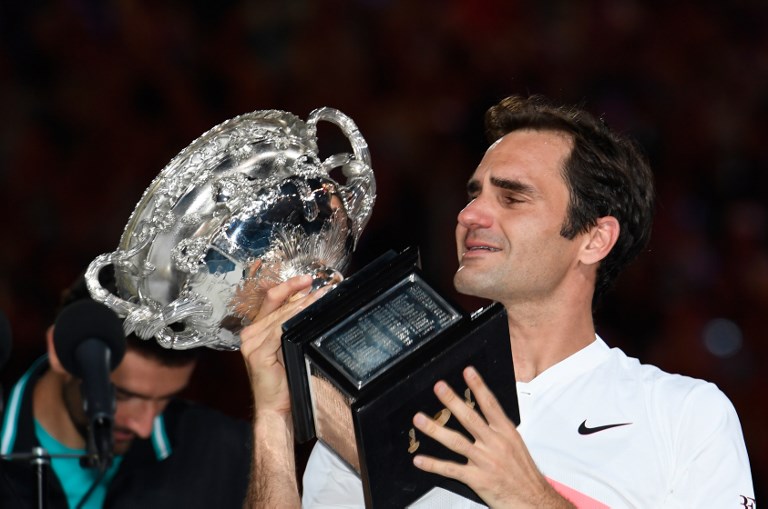
Now, to answer the question that we’ve asked at the start of the article: who is the GOAT of tennis? I personally choose Roger Federer. The numbers speak for themselves as we’ve seen in our previous comparisons. While Nadal is untouchable on the clay court and Djokovic performs best when it comes to the H2H, Roger has shown dominance and consistency over the years. And at age of 39, he is still giving his best.
It’s important to note that although we’ve chosen a scientific approach to solve this dilemma, questions of this type will always have a subjective answer. The data is always objective, our interpretation of the data is not.


