IQs, Income, and Temperatures.
A psychologist at Princeton University, Eldar Shafir, conducted a study while visiting 54 villages in India before and after harvest. Small-scale sugar-cane farmers in Tamil Nadu in southern India receive most of their year’s income all at once, shortly after the annual harvest. As a result, the same farmer can be poor before harvest and relatively rich after. The farmers were given two tests to document their cognitive ability (IQ). The farmers scored significantly lower on the tests before the harvest, when money was tight, suggesting that their worries made it harder to think clearly. In fact, worrying about money impaired the farmers’ thinking almost as much as going without sleep for a full night, and was the equivalent of a 13-point drop in IQ.
https://www.newscientist.com/article/dn24128-poverty-can-sap-peoples-ability-to-think-clearly/
Other researchers claim that higher temperatures can affect people’s capability to think and focus clearly.
This IQ small study will, very briefly, look for the IQ numbers, distributions, top 10 countries (ascending and descending), and the possible correlations with Income and temperature, using R and other tools.
The data source is worldpopulationreview.com. The information about the Average Income, IQ, and daily temperature of 160 countries of the world was downloaded, cleaned, and merged. The Null values for a certain criterion for a certain country were replaced by the average of the sub-region that this country belongs to.
N.B.: It is important to note that the IQ test is not a definite test of intelligence, and many other kinds of intelligence cannot be tested by this test. And the education and certain taught information can affect the results of this test.
IQ General Overview
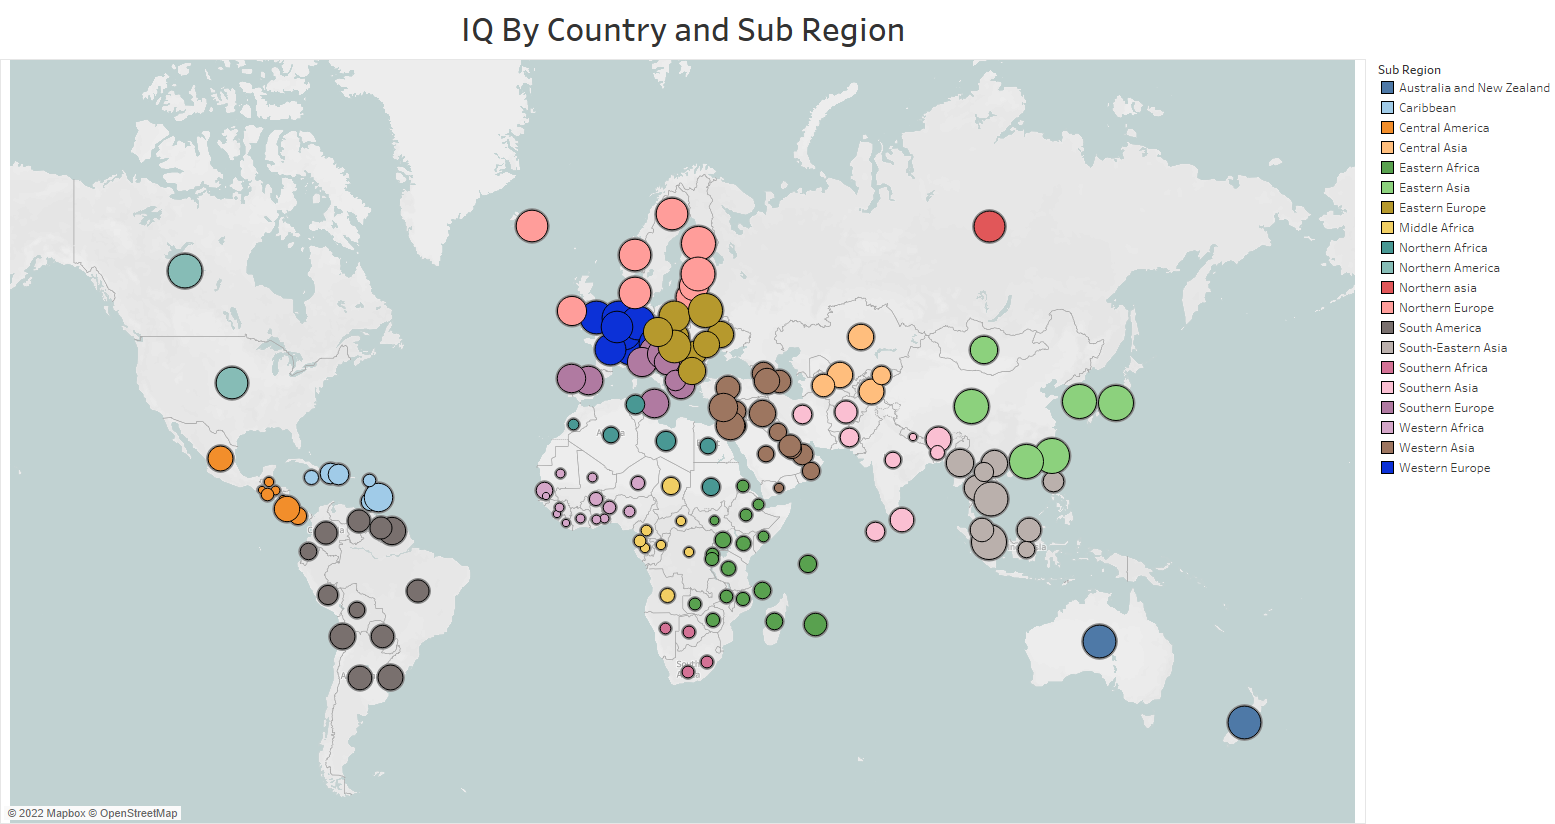
First of all, this map visualizes the IQ of countries as circles on the map. The bigger the bubble, the higher the IQ of the country.
You can see the details in this interactive map here.
We can see clearly that Eastern Asia, North Asia, North Europe, and North America have higher IQ values, but Africa and South Asia have the lowest values. Another way to compare IQs of different sub-regions:
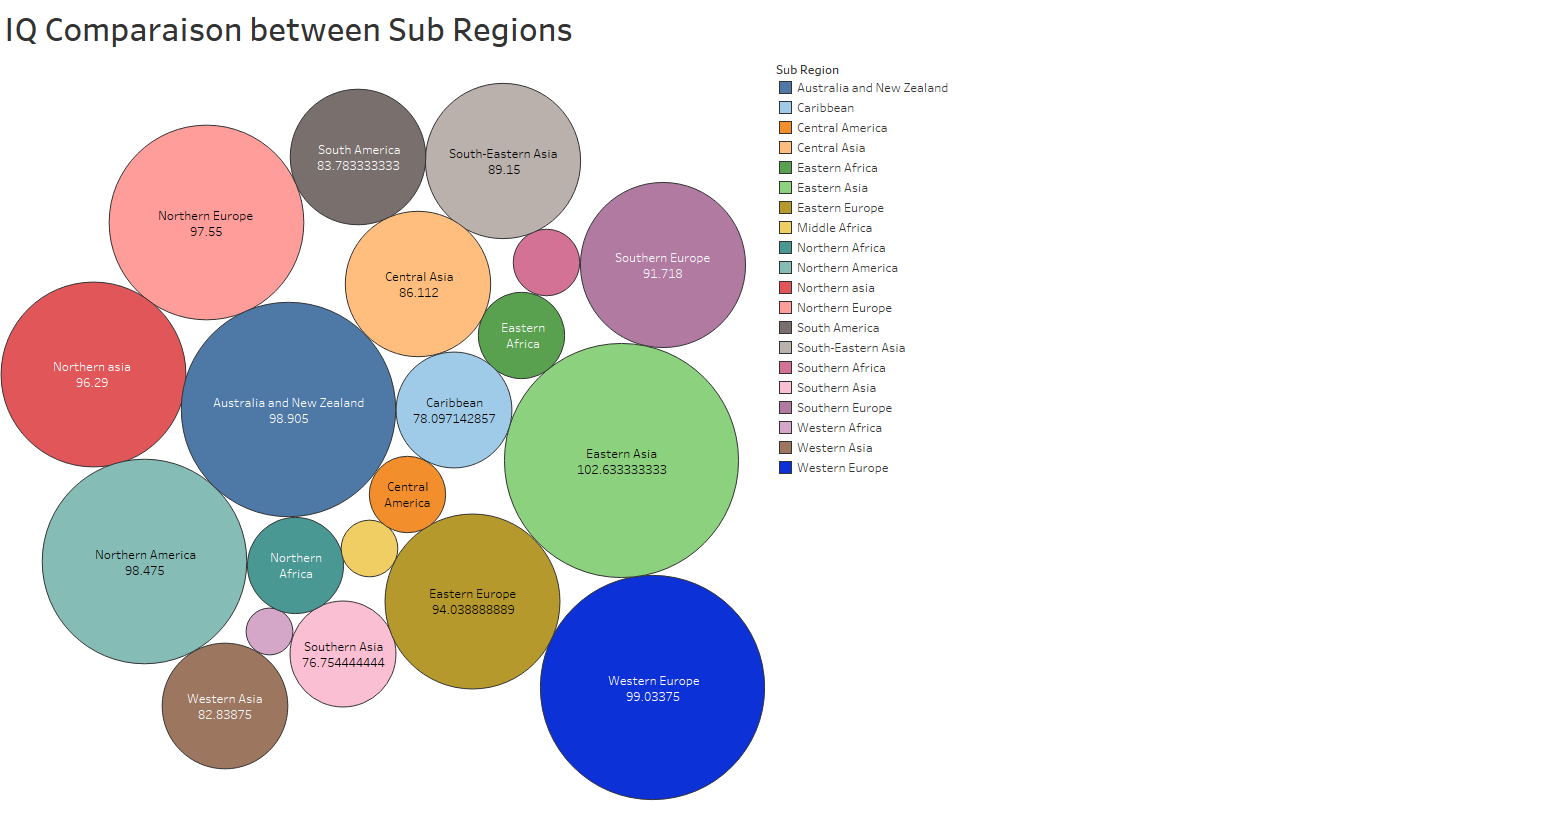
You can see the interactive packed bubbles in this link.
IQ Circles How IQ is generally distributed? We can see the overall distribution of the IQ in his histogram:
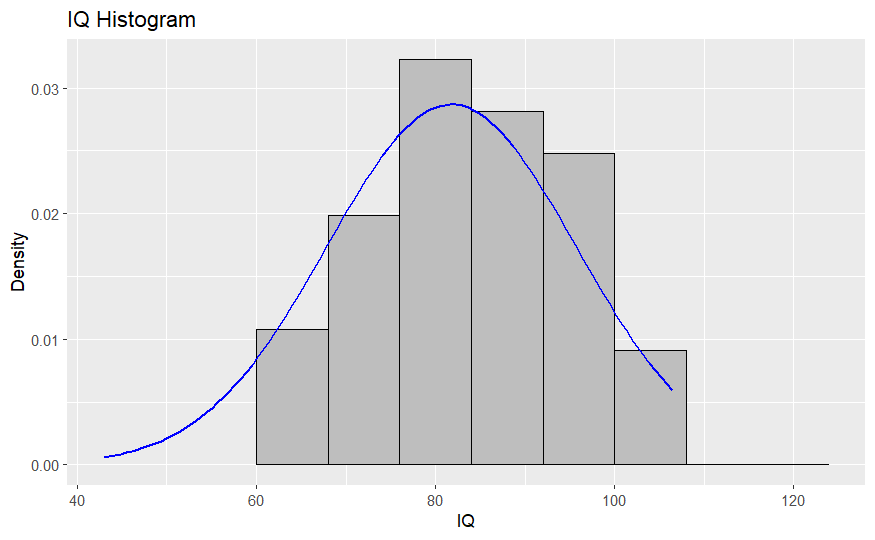
The IQ is nearly normally distributed. The average IQ of the world countries is around eighty. Most countries have an average IQ between 70 and 100. A small percentage is between 100 and 110, and a small percentage tends to have extremely low levels.
The rank of Lebanon in all variables
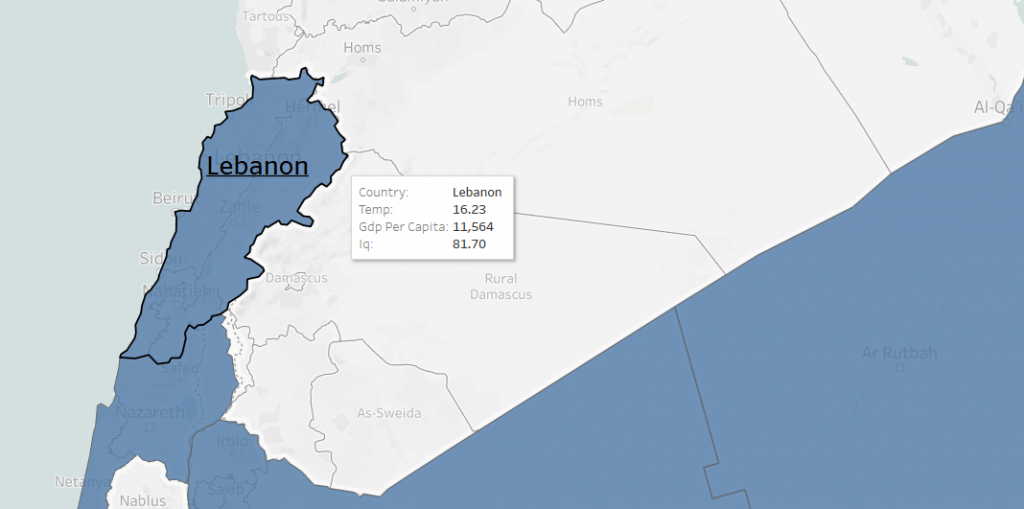
You can see the details in this interactive map here.
The IQ of Lebanon, on average, is 81.70. The average temperature is 16.23 and the average GDP is 11.564$ per year.
This box plot shows the IQ of the different Sub-regions on different continents. The colors show the continents, and the coordinates show the IQ values for each sub-region.
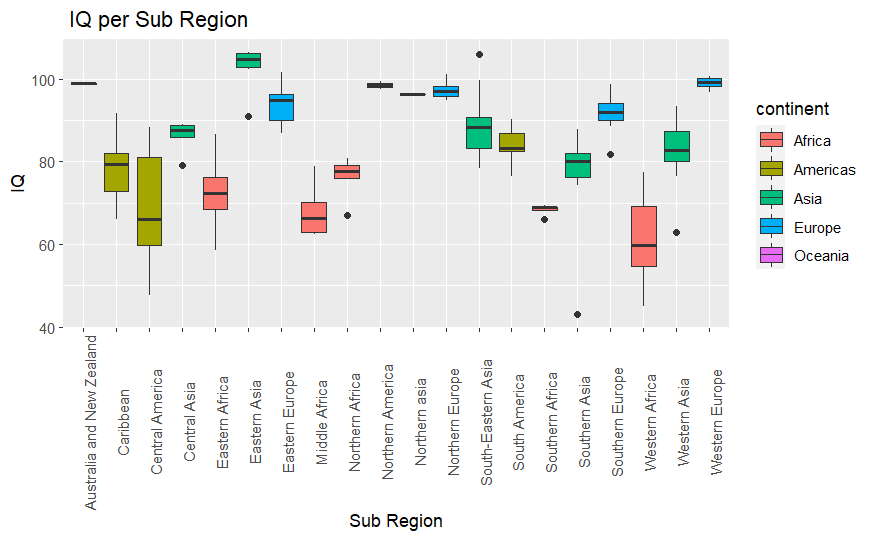
The higher IQs, as seen in the previous plot, are in Eastern Asia, and Europe (Eastern/Western/Northern/Southern) and the lower IQs are, unfortunately, the African countries and some Central American countries.
We can see the top ten highest and lowest countries in these bar charts.
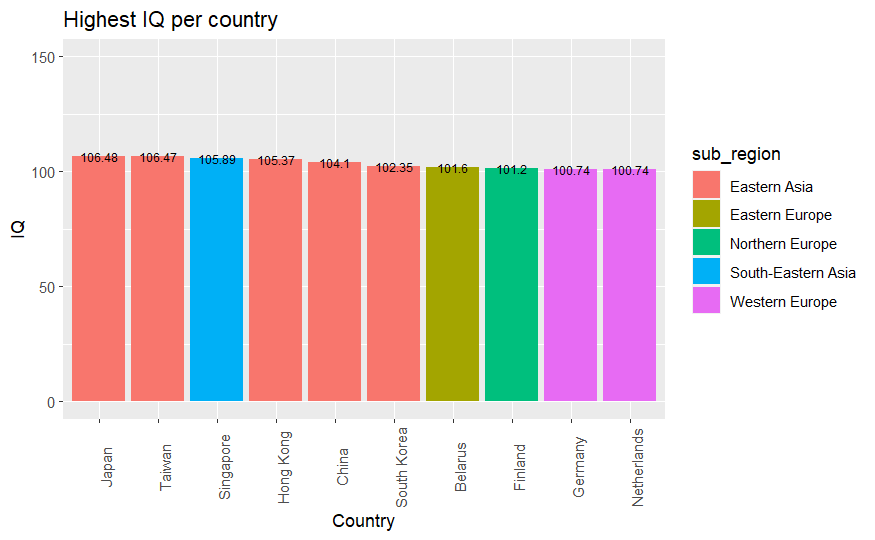
The highest IQ rank is in Japan, Taiwan, etc.… Most of the countries are in Eastern Asia and West Europe.
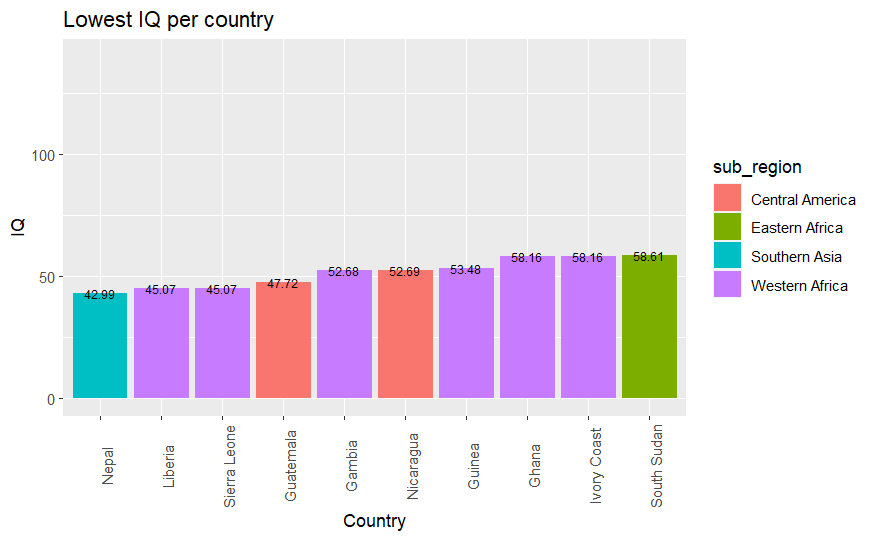
We can see a dramatic difference between the lowest countries and the highest countries. From 40 to 100+. Most of these countries are in Africa, due to poverty, lack of education, or other causes.
Income study through Country
You can see the details in this interactive map here.
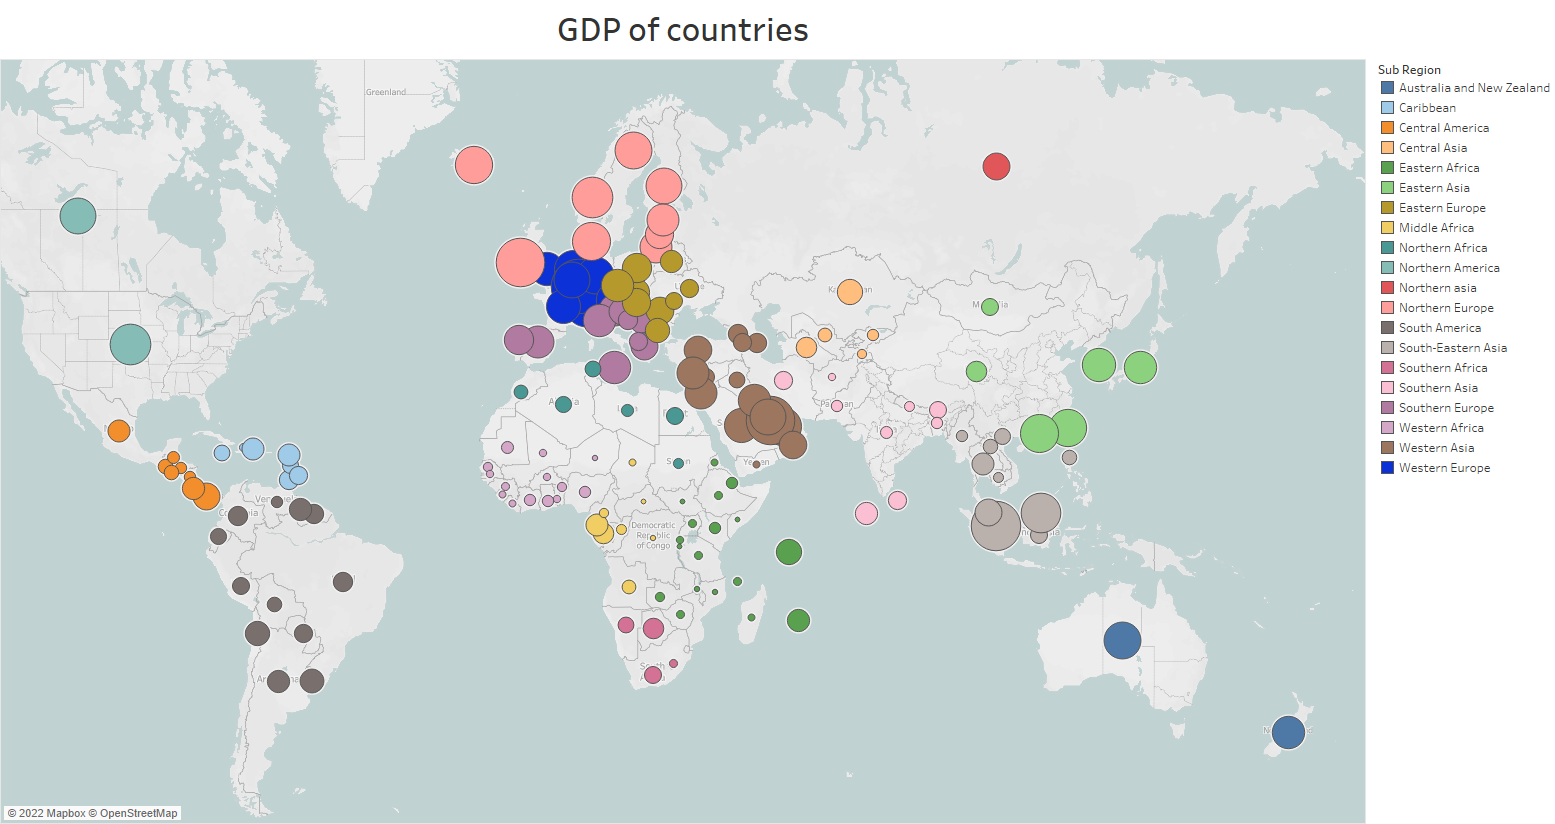
The size of the circles represents the GDP of the country, and the color represents the sub-region the country belongs to. Gross domestic product (GDP) is the standard measure of the value added created through the production of goods and services in a country during a certain period. As such, it also measures the income earned from that production or the total amount spent on final goods and services (fewer imports).
We can see that North Europe; West Europe North America and the Gulf region have the highest GDP and Africa in general and South Asia (colored in pink) have the lowest GDP.
GDPs in packed bubbles:
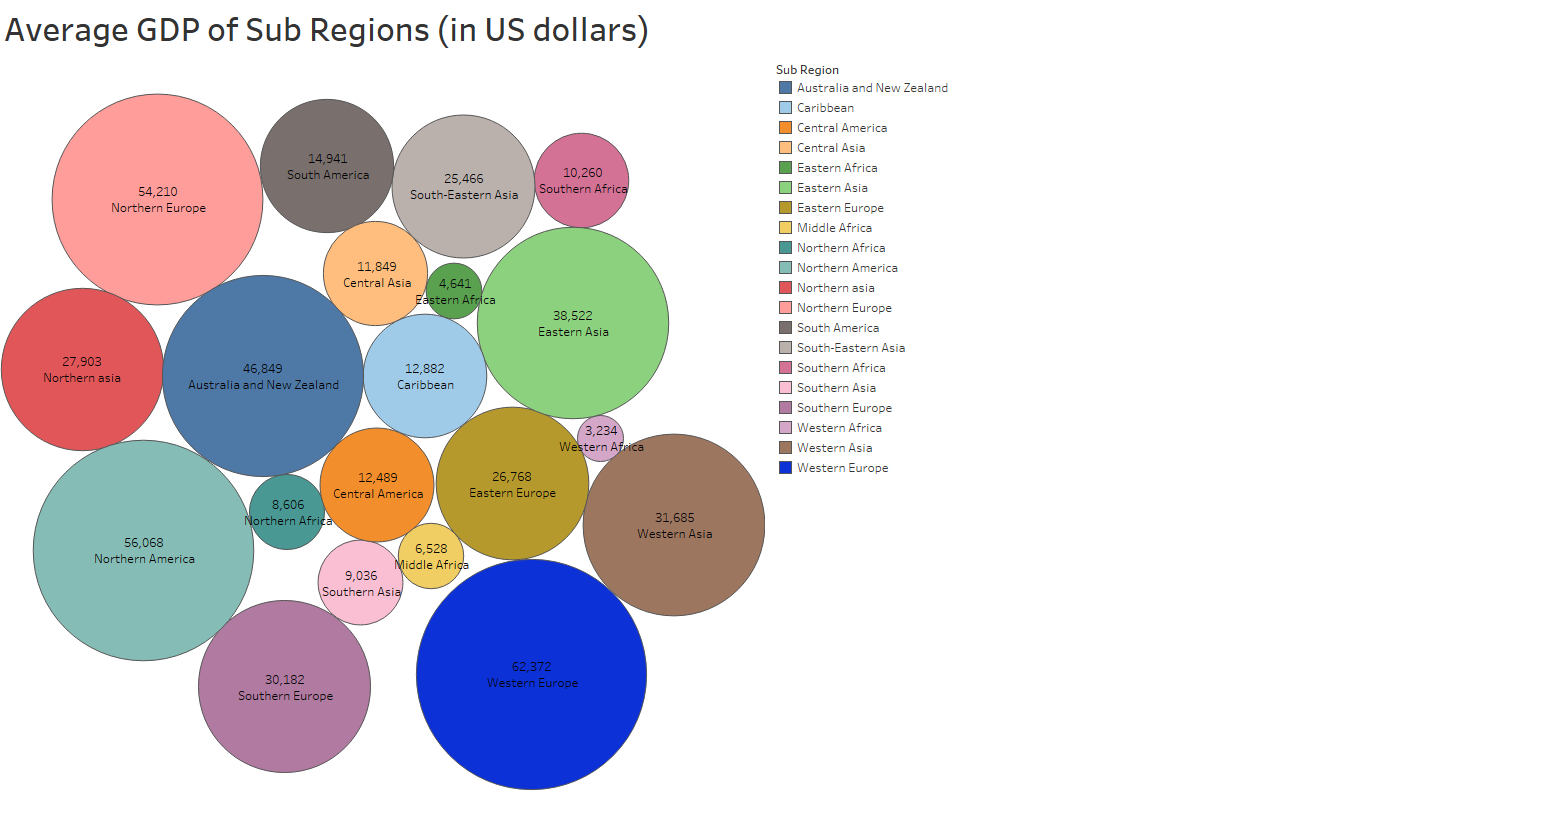
You can see the interactive map in this link.
The box plots of the GDP according to Continents and sub-regions:
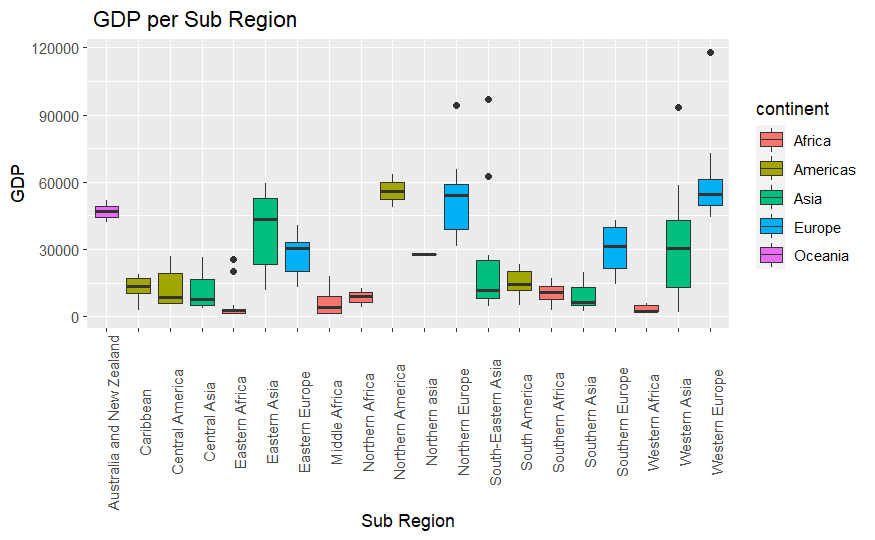
Oceania, North and West Europe have the highest GDP with relatively small standard deviations (small ranges), and Eastern Asia with a large standard deviation (large ranges between countries). African countries as seen before have very low values with small deviations.
We can see the overall distribution of the GDP in this histogram:
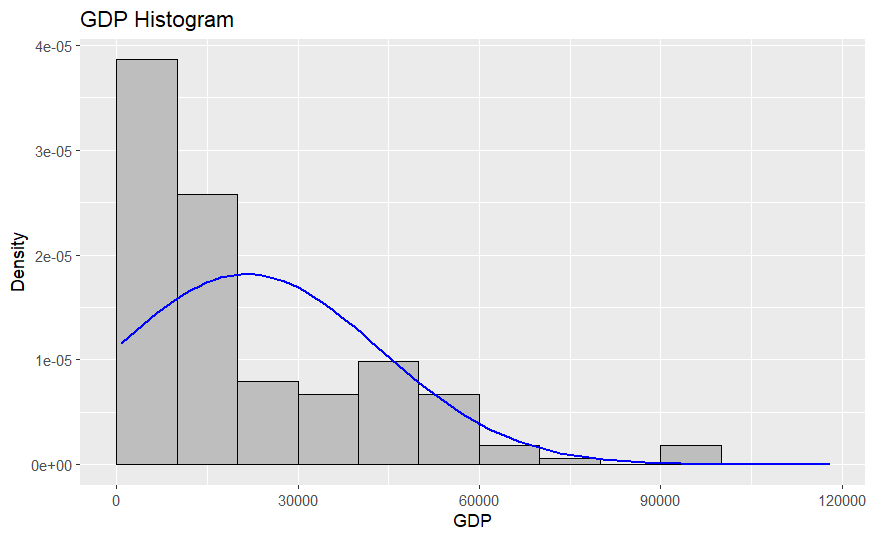
The histogram is not even close to a normal distribution. The graph is extremely skewed to the right which shows high inequality in Incomes between countries. Most countries have an average GDP between zero and ten thousand dollars per year, while some countries have an average GDP of more than 90000 dollars per year.
Temperatures
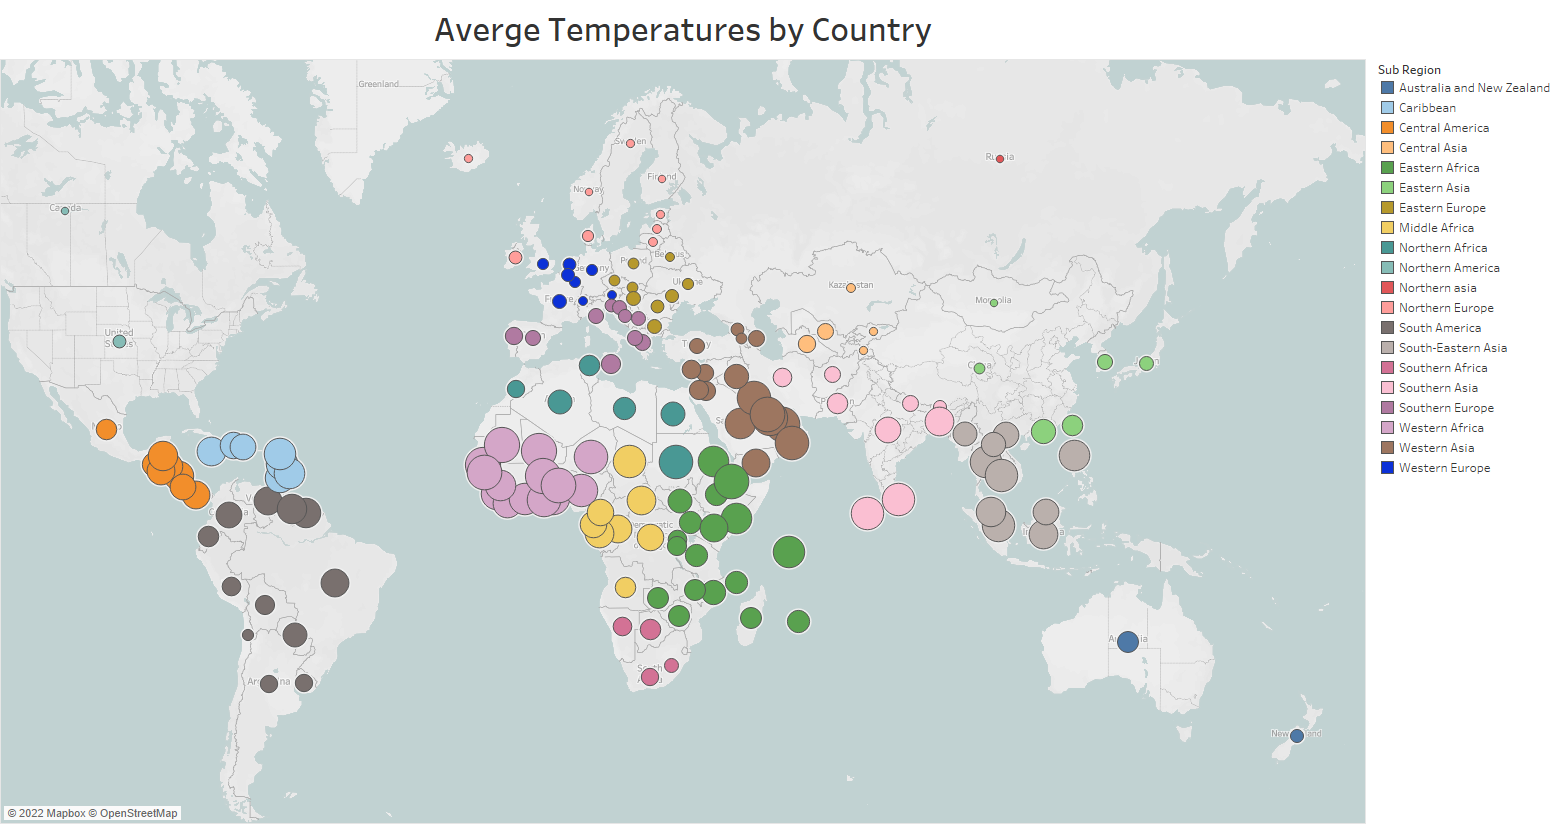
You can see the details in this interactive map here.
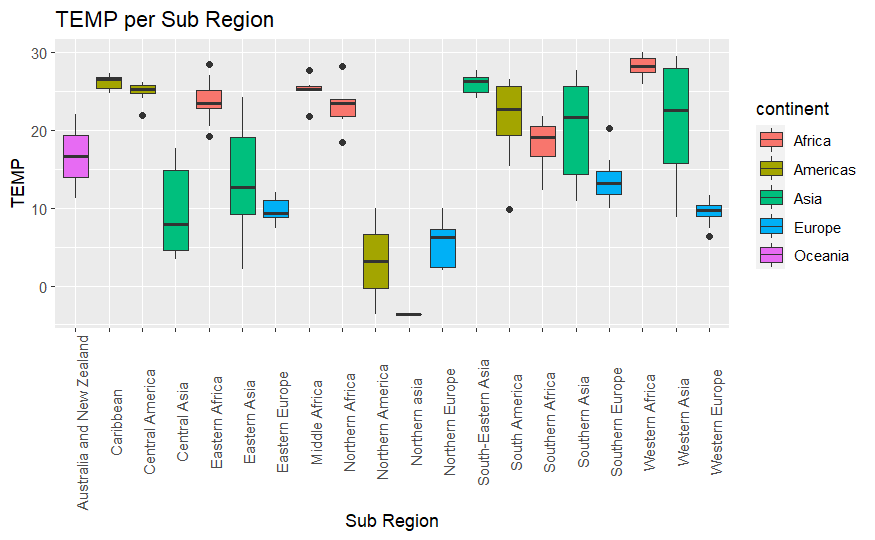
As expected, the highest temperatures are in the southern regions of the planet earth, especially in Africa.
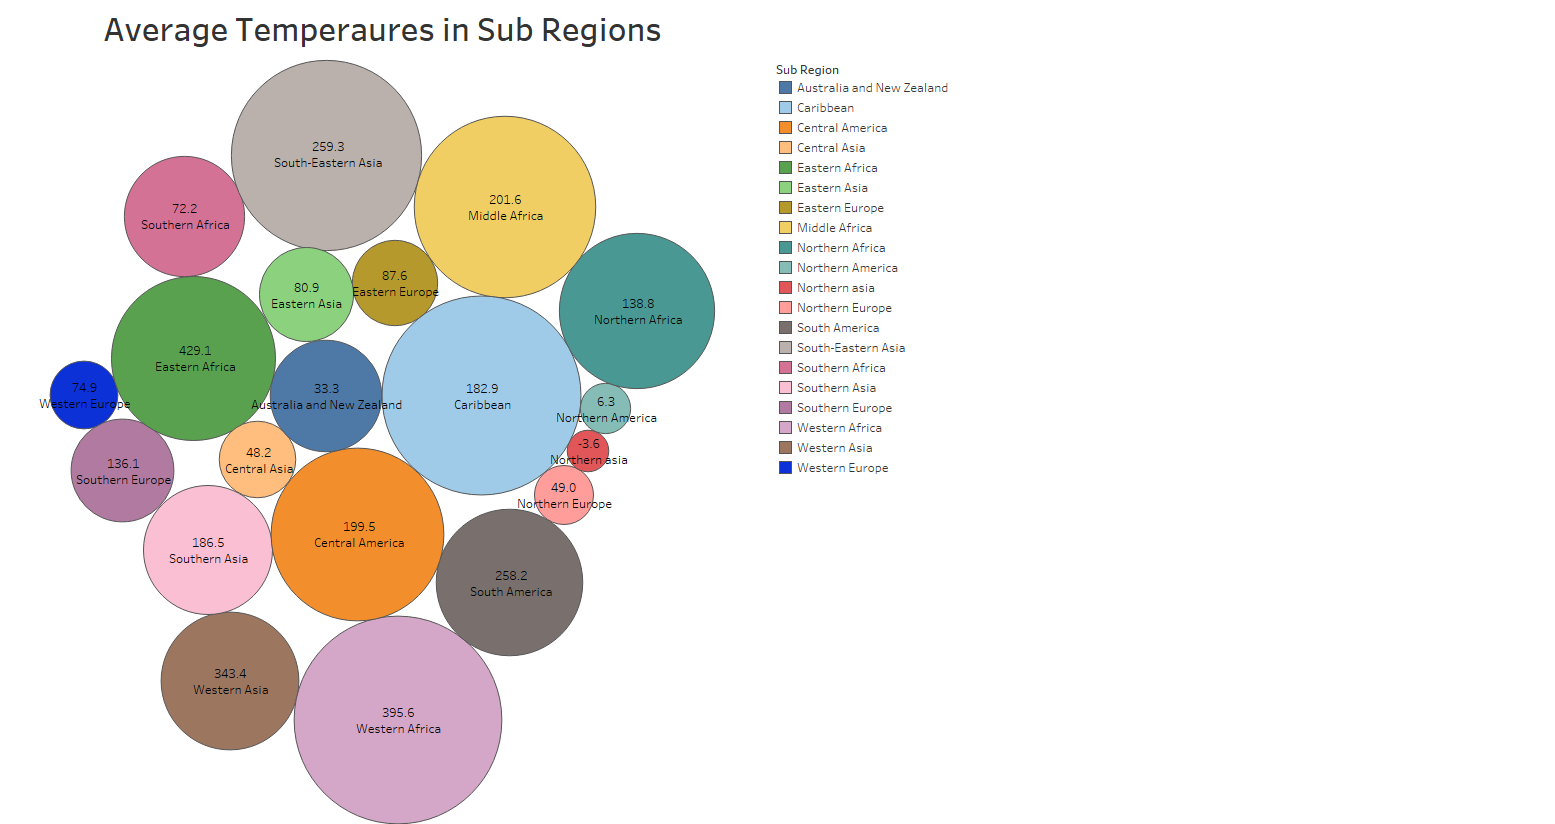
You can see the details in this interactive packed bubbles here.
The box plots of the GDP according to Continents and sub-regions:
IQ and GDP
To study the possible correlation between IQ, Income, and Temperature, we start by taking a hint from the scatter plots of IQ and Income first and the IQ and temperature.
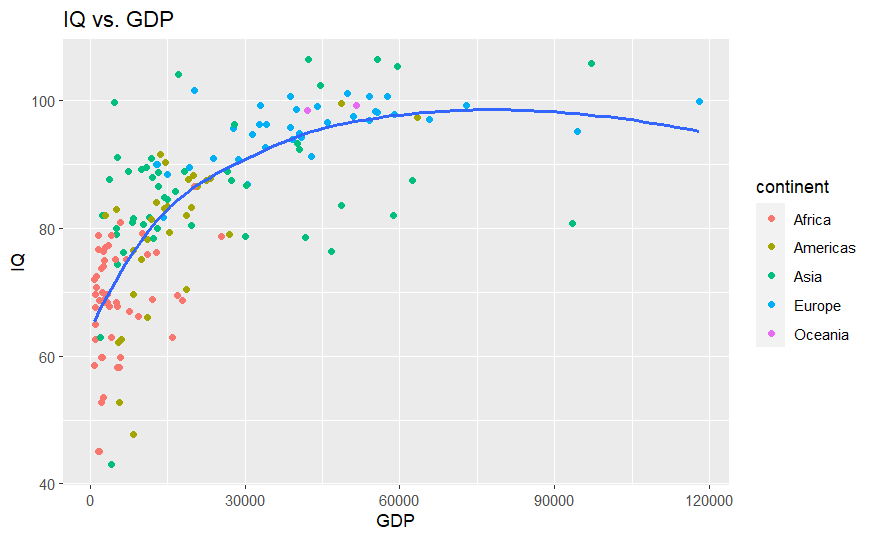
This scatter plot is incredibly significant: Most of the African countries (colored in orange) have low GDP and low IQ, and most of the European countries (in Blue) have high Income and high IQ. The Asian countries (colored in Green) have a wide range in GDP and in IQ from ten thousand to nearly 90000 but have approximately a high IQ level. The American continent is divided into two subgroups, 2 countries (Canada and USA) have high IQs and high Incomes and the others have less IQ and Incomes.
The most important thing we can “see” is that when the GDP increases the IQ increases also. The increase in IQ is amazingly fast when the GDP is low, but when the Income becomes high the increase in GDP is no longer significant. Most of the countries with high incomes have high IQ rates, but not all “low-income” countries have low IQ levels. So, we studied the possible correlation between GDP and log(IQ). The p-value of the linear model was less than 2.2e-16. This leads to an overall sure correlation. Following is the linear model assumptions study
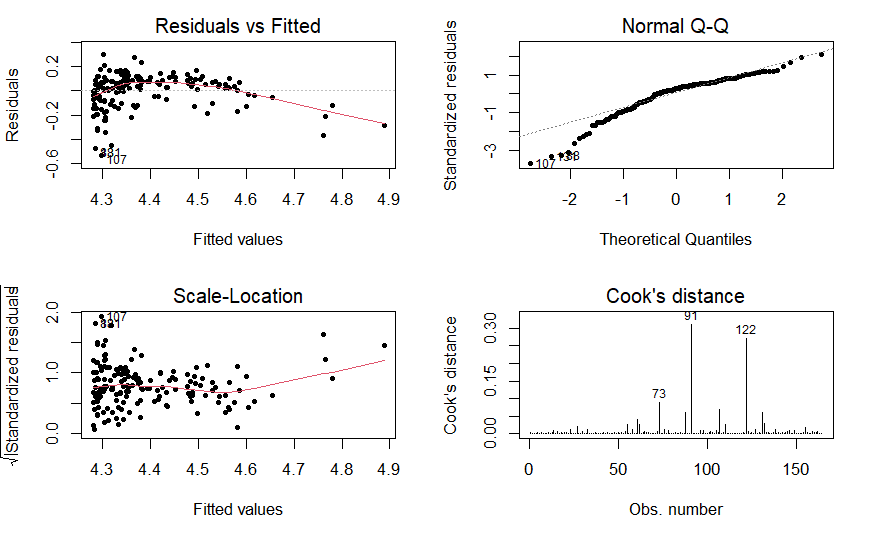
The residuals are nearly normal, and the variance is almost stable. We do not have total homoscedasticity and normality, so this model is not 100% trusty, but in general, we have a general trend between the log(IQ) and the GDP.
IQ and temperature
Concerning the temperature and the IQ, we have the following scatter plot:
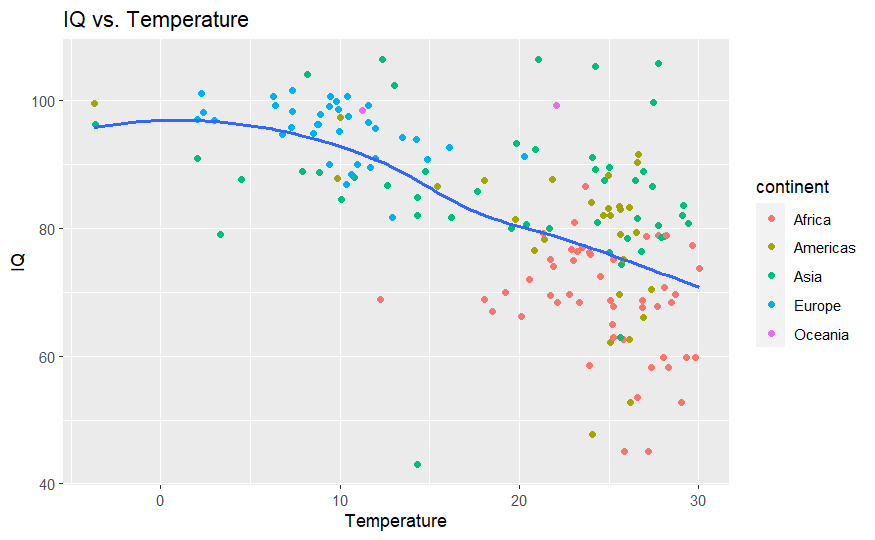
This plot shows that when the temperature tends to increase the IQ level tends to decrease. When studying the linear regression model, we have a p-value less than 2.2e-16. This shows the overall significance of the model. Following is the model assumptions study.
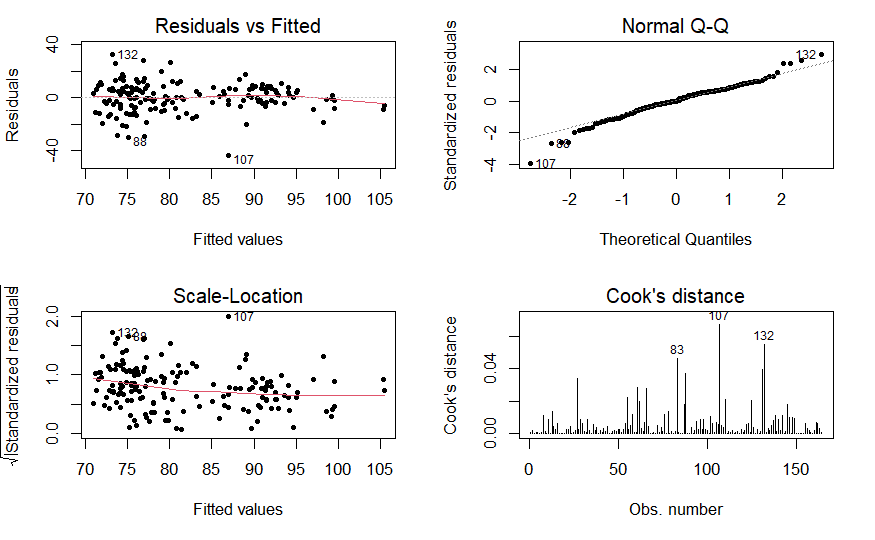
Like the first model, the residuals are nearly normal, and the variance is almost stable. We do not have total homoscedasticity and normality, so this model is not 100% trusty, but in general, we have a general negative trend between the IQ and the average temperature.
Are countries with higher IQs happier??
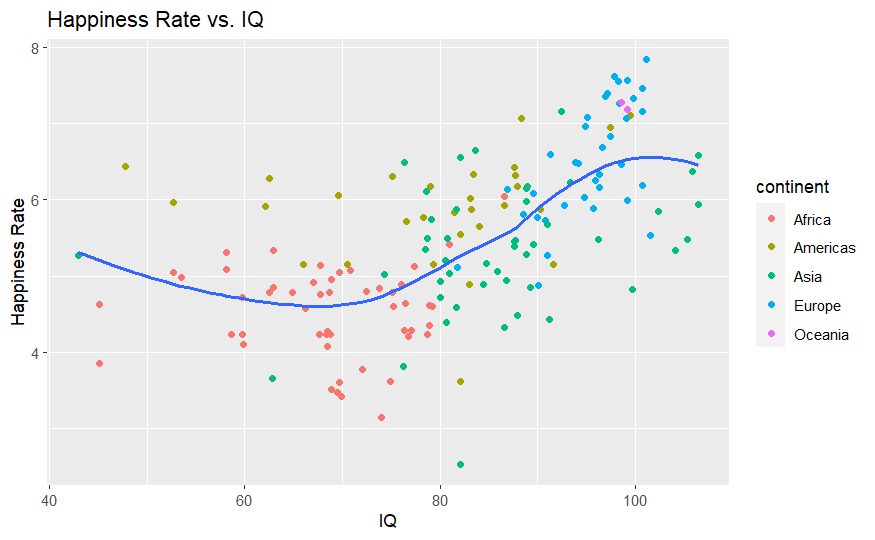
This plot does not show a relation between the happiness rates and the IQ measures of countries. Although countries with high IQs have also high happiness rates, countries with low IQs have lower happiness rates.
IQ and Education
IS IQ related to education? Does higher education help to have higher IQs? This US study gave these results:
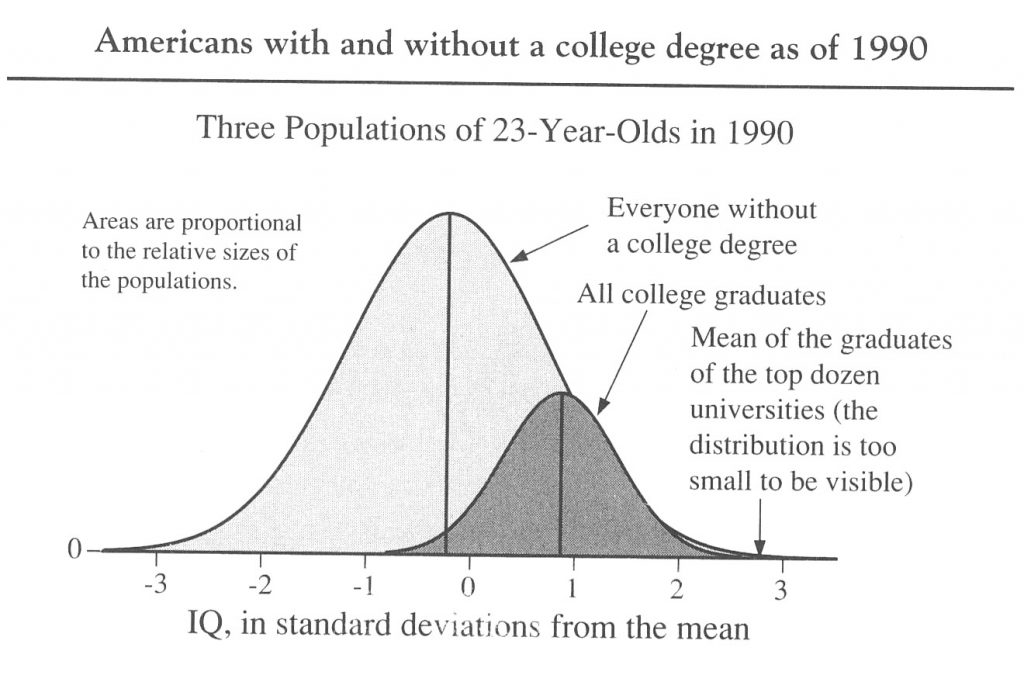
The average IQ of a college degree graduate is higher than the average IQ of a person without a college degree. Actually, most of the college degree graduates distribution is higher than the average of the people without a college degree. Significant!!
IQ and Population
Finally, we can answer the question: Are people getting smarter with time? Actually: Not precisely. The Mean IQ of the world over time compared to the total population:
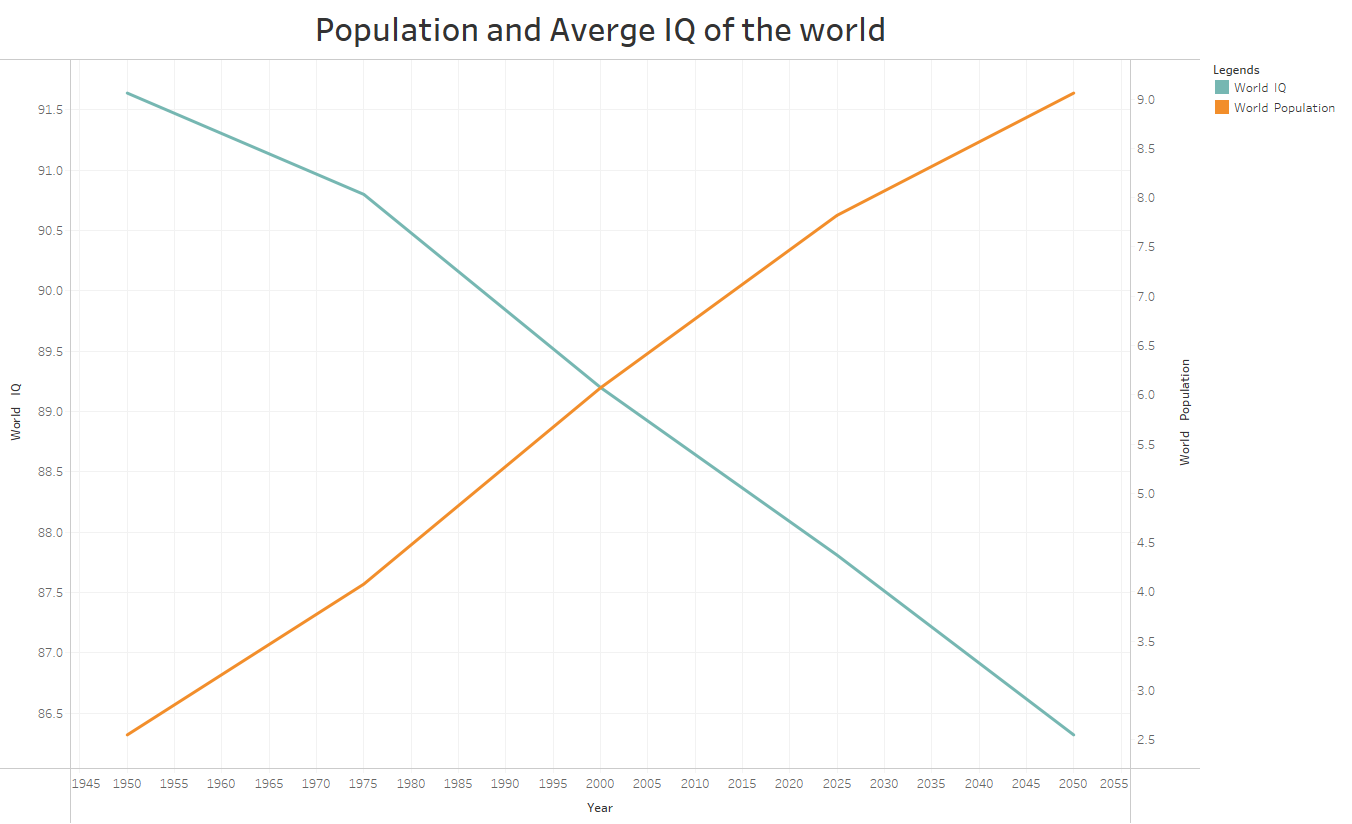
You can see the interactive plot in this link.
With years, the earth’s population is increasing (obviously), but surprisingly, the IQ is decreasing there are two explanations for the decrease in IQ over time: With higher technological advancement, people tend to rely on machines to “think” for them. The other explanation is that high-IQ countries (which normally have low birth rates) have had less population over the years, and the Low IQ countries have had more population over the years, and this causes the average to decrease.
Conclusion:
The IQ, especially, log(IQ) tends to have a correlation with the GDP. We cannot prove this relation, but an overall trend exists as the graph shows. And a slight increase in the GDP can cause a high increase in IQ. After this slight increase, IQ tends to increase slowly. This means that countries, need the minimum amount of income to fulfill their mental potential.
On the other hand, IQ and temperature tend to have a negative correlation as shown in the graph. When the temperature increases, the IQ decreases, but it is not proven if the temperature is a direct cause or simply correlated with the IQ.
IQ and happiness do not show any obvious correlation (according to these statistics). Educated people tend to have higher IQs. And the IQ of the world is decreasing with time!!!
