Close your eyes for a moment and picture this: you’re standing in the heart of Silicon Valley. The air crackles with ambition. Garages birth billion-dollar dreams. All around you, innovation pulses like electricity—unstoppable, thrilling, addictive. But step back from the glow of neon success, and a quieter question hums beneath the surface: What really makes a startup succeed? Is it simply the size of their funding round? The luck of timing? A prime location on the map? Or could the answer lie deeper hidden in patterns only data can reveal?
This is where our journey begins. Armed with a powerful dataset from Kaggle and the analytical tools of Power BI, R, and Python, we set out to decode the startup world—not through hype, but through evidence. We sift through thousands of data points, trace the flow of capital across industries and borders, and chart growth in all its glorious complexity.
So whether you’re a founder sketching your pitch deck, an investor searching for the next big win, or simply curious about what fuels the future—come along. Together, we’ll pull back the curtain on startup success and uncover where the smartest bets are truly being placed.

Who’s Getting the Money—And Who’s Being Overlooked?
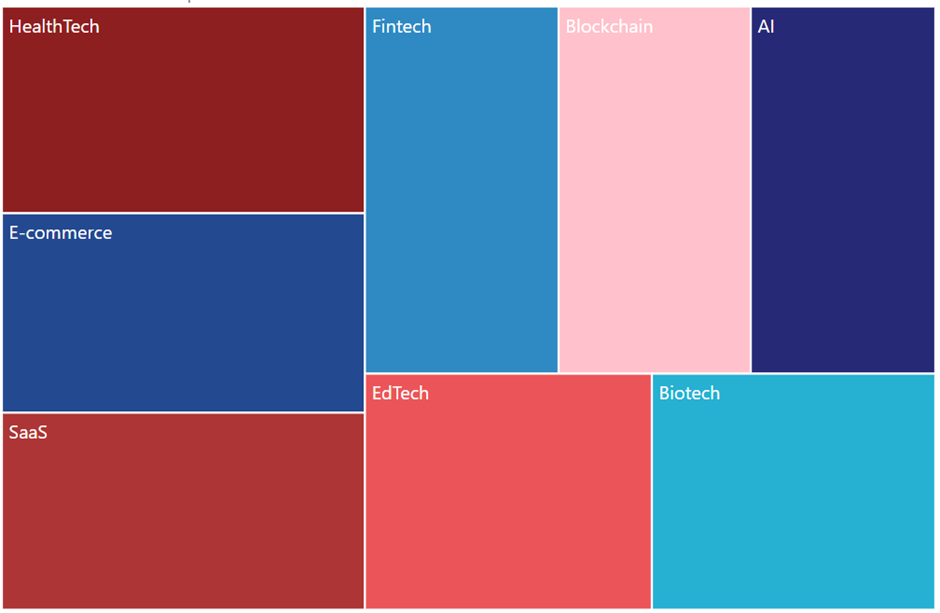
Figure 1: Startup Investment Distribution by Industries
Our journey begins with a snapshot of where the money is flowing. The treemap paints a clear picture: HealthTech, E-commerce, and SaaS dominate the investment landscape—industries tightly linked to digital transformation and scalability.
But then something catches the eye. Biotech and EdTech—two sectors with rising importance in health and education—barely make a dent in the capital flow. The question practically asks itself: Is investment volume a true measure of potential?
As we’ll soon discover, the answer is more complicated than it seems. Funding is just one piece of the story.
Money Isn’t the Whole Story:
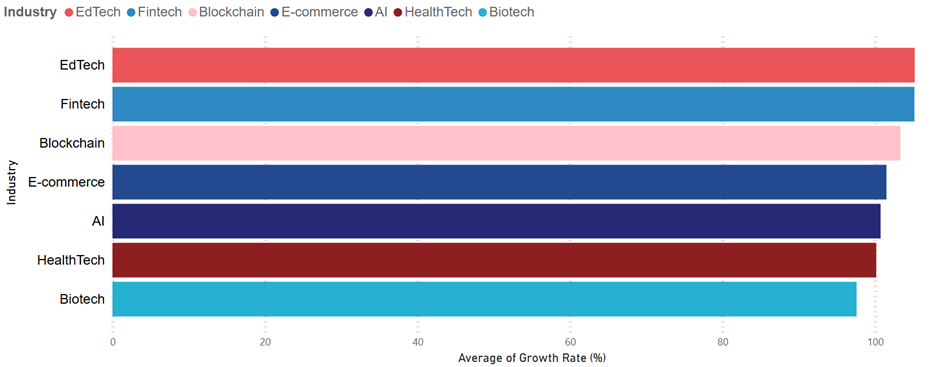
Figure 2: Average Growth Rate by Startup Sector
Now, let’s shift the lens—from how much money industries receive to how they actually perform. Here’s the twist: growth rates across sectors are surprisingly similar. Most industries, regardless of funding, cluster around the same average pace.
Even Biotech, with limited capital, keeps up. And lean sectors like EdTech, Fintech, and Blockchain? They slightly edge ahead.
It’s a surprising reveal—one that forces us to rethink what really drives success. If everyone’s growing at the same speed, is more funding truly the magic ingredient?
The Hidden Waves Beneath the Growth:
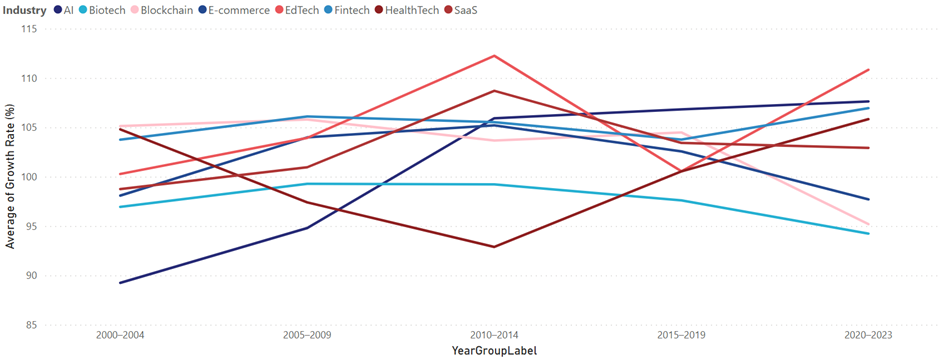
Figure 3: Average Growth Rate of Startup Sectors Over Time
Average growth rates give us a snapshot—but they don’t reveal the journey. So we zoomed out across time, tracing how industries have actually evolved.
EdTech surged during 2010–2014, then roared back in 2020–2023, riding waves of mobile learning and the global shift to remote education. AI followed a steady, quiet climb—gaining traction year after year, powered by automation, analytics, and the rise of generative intelligence. HealthTech spiked after 2020 which aligns with the pandemic-driven transformation in healthcare delivery and increased investment in health innovation. Meanwhile, other industries rose and fell like tides—unpredictable and reactive.
These timelines reveal something critical: growth isn’t always steady, and it’s rarely simple. In a world of volatility, timing and context often matter more than sheer speed.
Where Smart Growth Outshines Big Money:
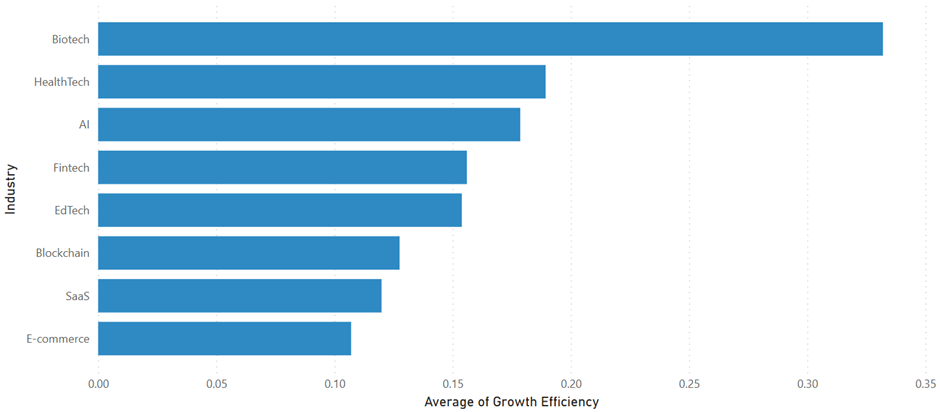
Figure 4: Growth Efficiency Across Startup Industries
Now that we’ve explored how industries grow, the next question becomes: how efficiently do they grow?
This is where the story takes a sharp turn. Biotech, despite being one of the least-funded sectors—rises to the top in growth efficiency. It’s not just growing; it’s growing smart, turning every dollar into meaningful progress. HealthTech and AI hold a respectable balance between capital and performance. But the surprise? E-commerce and SaaS, two of the biggest magnets for investment, rank at the bottom in efficiency. The numbers hint at bloat—more money going in, less value coming out.
The message is clear: performance isn’t just about how much you raise—it’s about how well you use what you’ve got.
Valuation: When Perception Outpaces Performance:
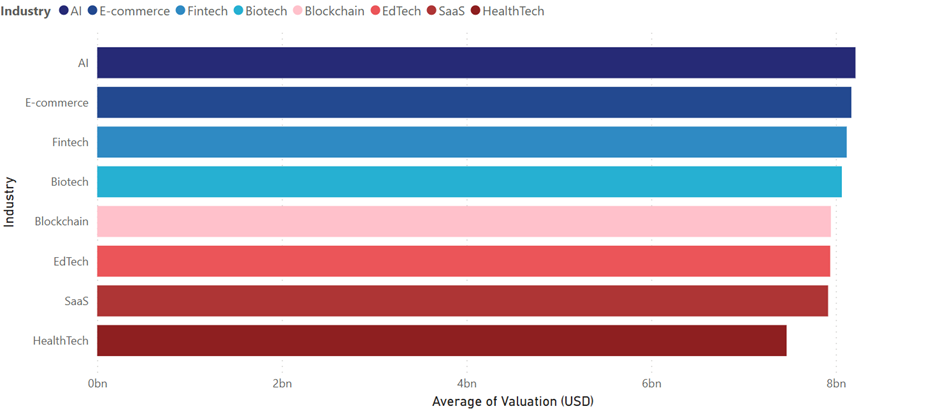
Figure 5: Average Startup Valuation by Sector
Valuation tells us what the market believes a startup is worth—but belief doesn’t always reflect performance.
AI tops the charts in valuation, driven by investor excitement and bold future bets. E-commerce and Fintech follow closely, riding on established revenue models and familiar narratives. Yet when we look closer, many of these high-valued sectors—like SaaS and HealthTech—struggle to deliver strong growth efficiency. Meanwhile, Biotech, which consistently proves itself as the most efficient, receives far less attention in valuation rankings. It’s a telling gap—one that reveals how easily hype can outweigh substance in the startup world.
But to truly understand this misalignment between capital, performance, and perception, we need a wider lens. Instead of focusing on one metric at a time, what happens when we look at all of them together?
Peeling Back the Hype: A Full-Body Scan of Each Industry:
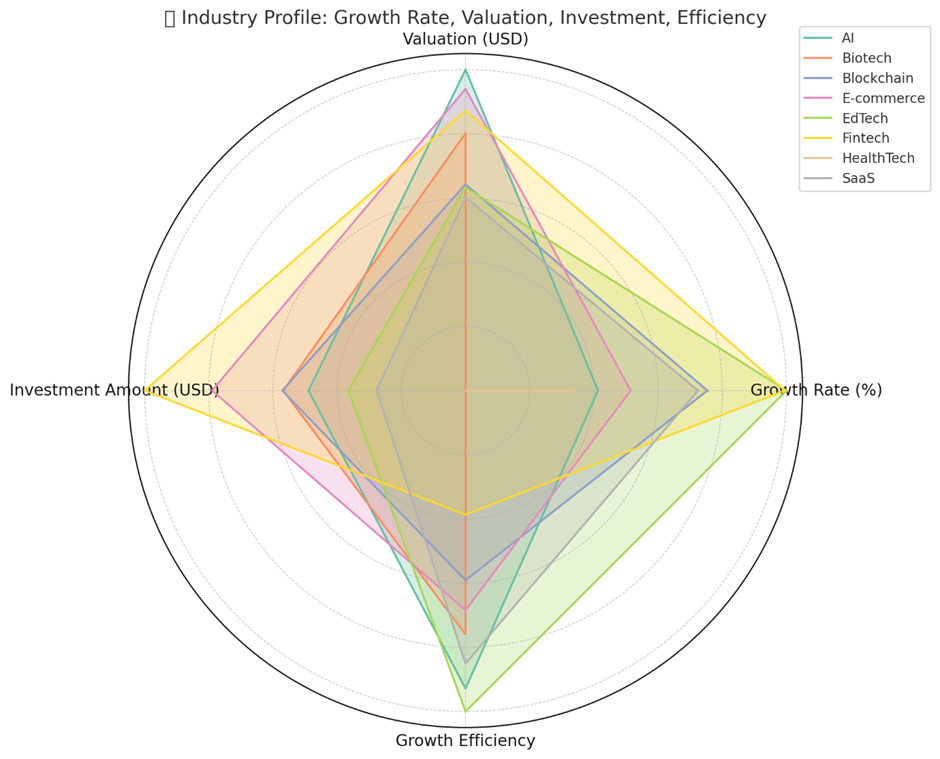
Figure 6: Startup Industry Profiles: Growth, Valuation, Investment & Efficiency
If valuations reflect investor belief, this radar chart shows us the reality check. By mapping each industry across four dimensions—Growth Rate, Valuation, Investment, and Efficiency—we finally see the whole picture.
EdTech emerges as a quiet powerhouse. With the highest normalized growth and efficiency, and one of the lowest investment amounts, it proves that lean doesn’t mean weak. In fact, it’s one of the most agile, high-performing sectors in the landscape. Fintech, by contrast, tells a different story. Despite massive investment and impressive growth, its efficiency lags—suggesting its rise may be driven more by capital momentum than true operational strength. AI presents a balanced profile: high valuation, solid efficiency, and consistent growth—backing up investor confidence with real performance. And Biotech? While it previously shined in pure efficiency, its radar shape reveals a narrower focus. Its standout strength is clear, but it lacks the broader balance of a sector like EdTech.
Together, this view confirms a critical insight: high valuation doesn’t always signal high performance. Some industries thrive on perception—others quietly outperform it.
When the Numbers Speak: Correlation Reveals the Truth:
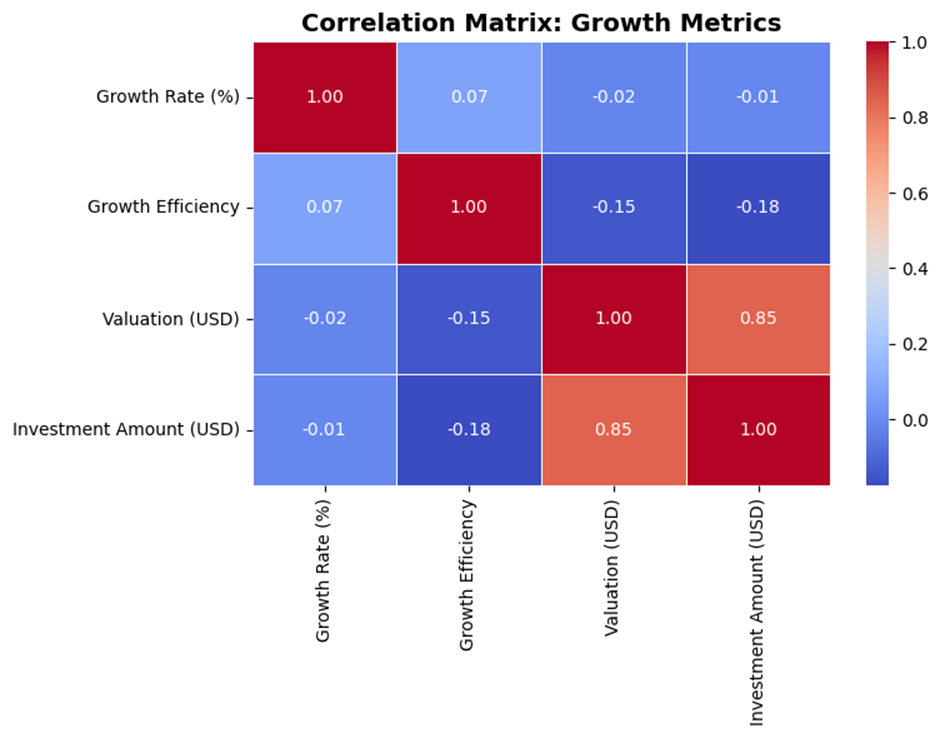
Figure 7: Correlation Between Key Startup Growth Metrics
So far, we’ve seen how perception, performance, and investment don’t always align. But is this just coincidence—or is there a deeper pattern?
To find out, we turned to the numbers. The correlation matrix below tests how our key metrics—investment, valuation, growth, and efficiency—actually relate. Valuation and investment are tightly linked, with a correlation of 0.85. It’s a statistical nod to the idea that hype and capital often go hand-in-hand.
But here’s the twist: growth efficiency? It barely correlates with either. Sometimes it’s negative. That means the smartest, most sustainable growth isn’t necessarily where the big money goes.
Beyond Borders: Where the Money Really Flows:
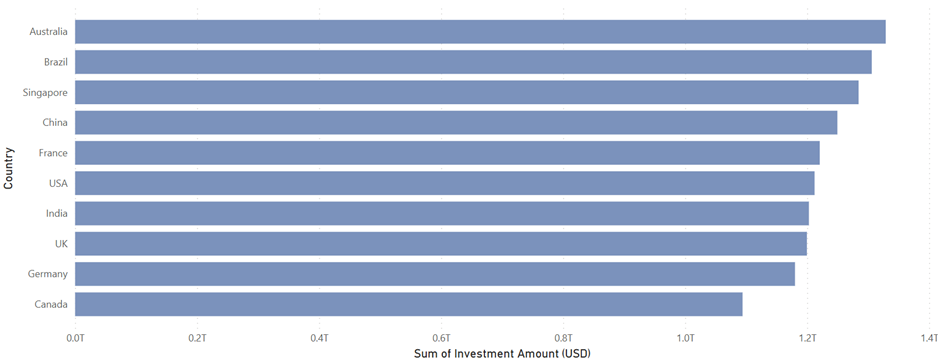
Figure 8: Total Startup Investment by Country (USD)
Until now, we’ve explored industries—how they grow, what they’re worth, and how efficiently they use capital. But there’s another powerful force shaping startup success: geography.
A global view of startup investment reveals some unexpected leaders. Australia, Brazil, and Singapore top the list, outpacing even longtime giants like the USA and UK.
But big investment doesn’t always mean better opportunity. In some cases, it may reflect crowded markets, inflated valuations, or fierce local competition. Meanwhile, countries receiving slightly less funding may hold the advantage—emerging ecosystems where innovation has room to grow and capital stretches further.
Still, as we’ve learned, money alone never tells the whole story. The real question is: which countries are turning investment into meaningful, efficient growth?
Doing More with Less: The Efficiency Champions:
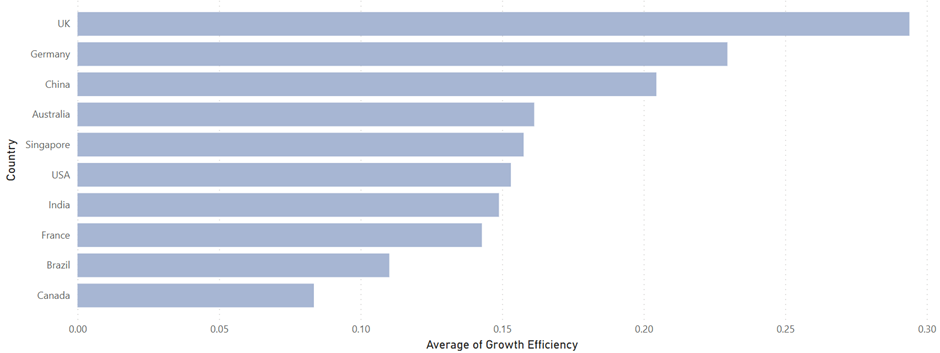
Figure 9: Average Startup Growth Efficiency by Country
When we shift focus from how much countries invest to how well they use that investment, a striking contrast emerges.
The UK rises to the top—not in funding, but in efficiency. With far less capital than some of its global peers, it achieves the highest average growth efficiency. Germany and China follow close behind, showing that disciplined ecosystems can outperform even the biggest spenders.
On the flip side, countries like Brazil and Canada, despite their sizable investments, struggle to convert capital into consistent growth—proving that money, without strategy, often falls short.
This divide raises a compelling question: What exactly is fueling these high-efficiency nations? To answer that, we need to look deeper—at how individual countries shape the industries they dominate.
The Power of Place: Where Industry Efficiency Is Born:
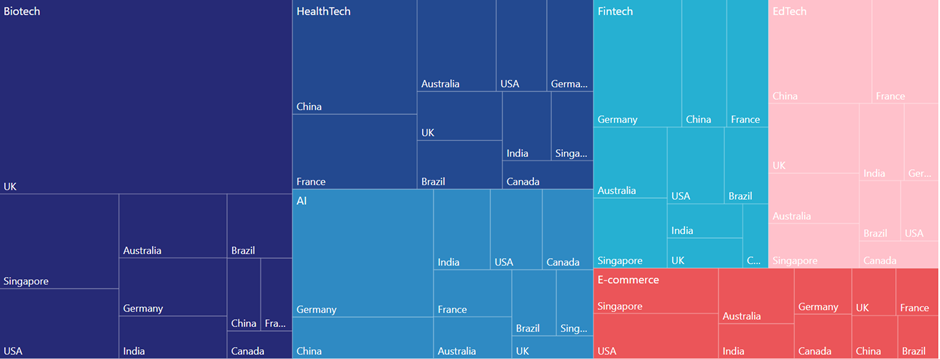
Figure 10: Startup Growth Efficiency by Sector and Country
To truly understand why some countries lead in efficiency, we need to zoom in—on the industries they champion.
This treemap reveals just that: how much each country contributes to the overall efficiency of each sector. And the results are striking. Biotech’s exceptional performance? It’s largely thanks to the UK, whose ecosystem fuels the majority of the sector’s growth efficiency. In HealthTech, China takes the lead. In AI, Germany emerges as a quiet powerhouse. What we see isn’t just global industry success—it’s localized brilliance. These aren’t just sectors that happen to be efficient. They’re driven by nations where innovation, talent, and resources align.
It’s a powerful insight for investors: to place smarter bets, don’t just look at what to invest in—look at where that excellence is being built.
Tying It All Together: Rethinking What Success Looks Like
As we’ve explored each layer of the startup world—from where money flows, to how efficiently it’s used, to which countries quietly fuel entire industries—one thing has become clear: the story behind startup success is far more intricate than the headlines suggest.
Funding may open doors, but it doesn’t guarantee growth. Our journey revealed sectors like Biotech and EdTech that thrive with less capital, while giants like SaaS and Fintech sometimes underdeliver despite outsized investments. And when we shifted focus to geography, we found that nations like the UK and Germany lead not in volume, but in value—turning modest resources into meaningful outcomes.
What started as a data deep-dive turned into something more: a redefinition of what startup success really looks like. It’s not just about capital—it’s about how, where, and why that capital is used.
References
https://www.kaggle.com/datasets/adilshamim8/startup-growth-and-investment-data
Joyce Ghosn
