Introduction: Unveiling the Enigma of UFO Sightings
Have you ever looked up at the sky, spotted something strange, and wondered: “If I saw a UFO, what would I even write in the report?” Would you mention the color? The speed? The way it hovered or disappeared?
This article explores that very question—diving deep into the when, where, and how of UFO sightings worldwide. In addition, we use visualizations and storytelling to not only report what people saw, but also what they felt. Through this, we uncover how culture, technology, and language shape our perception of the unknown.
The Mission: Questions We Seek to Answer
To uncover the patterns behind UFO reports, we set out to answer:
When are sightings most frequent?
Where do they occur most often?
What shapes do people report?
How long do encounters last?
What do people actually say in their reports?
Our approach was not just analytical—it was human. Therefore, we wanted to understand how people experience and communicate the extraordinary.
Tools of the Trade
We used Python libraries such as `pandas`, `matplotlib`, `seaborn`, and `WordCloud` to analyze a cleaned dataset of over 80,000 UFO sightings. The dataset includes timestamps, shapes, durations, and descriptions.It had been preprocessed to ensure consistency in date formats and geographic data.
UFO sightings analysis
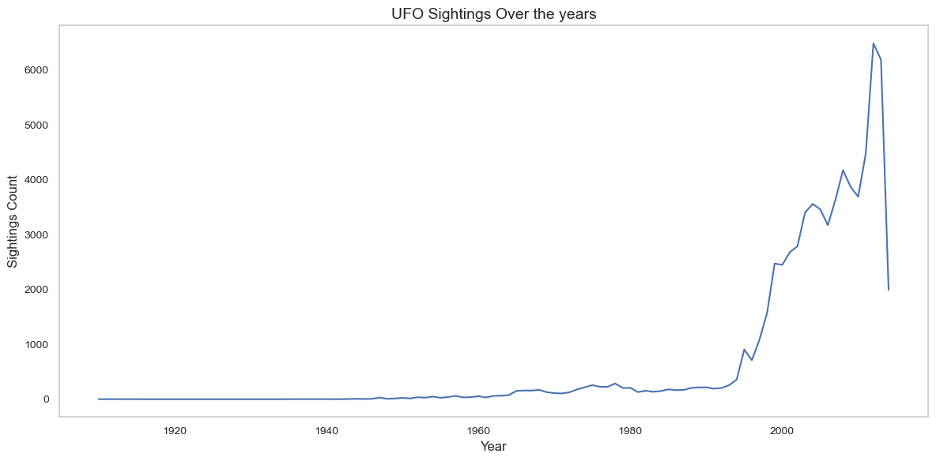
1. Time Patterns in UFO Sightings
Sightings stayed steady from 1920 until a sharp increase began in 2000.
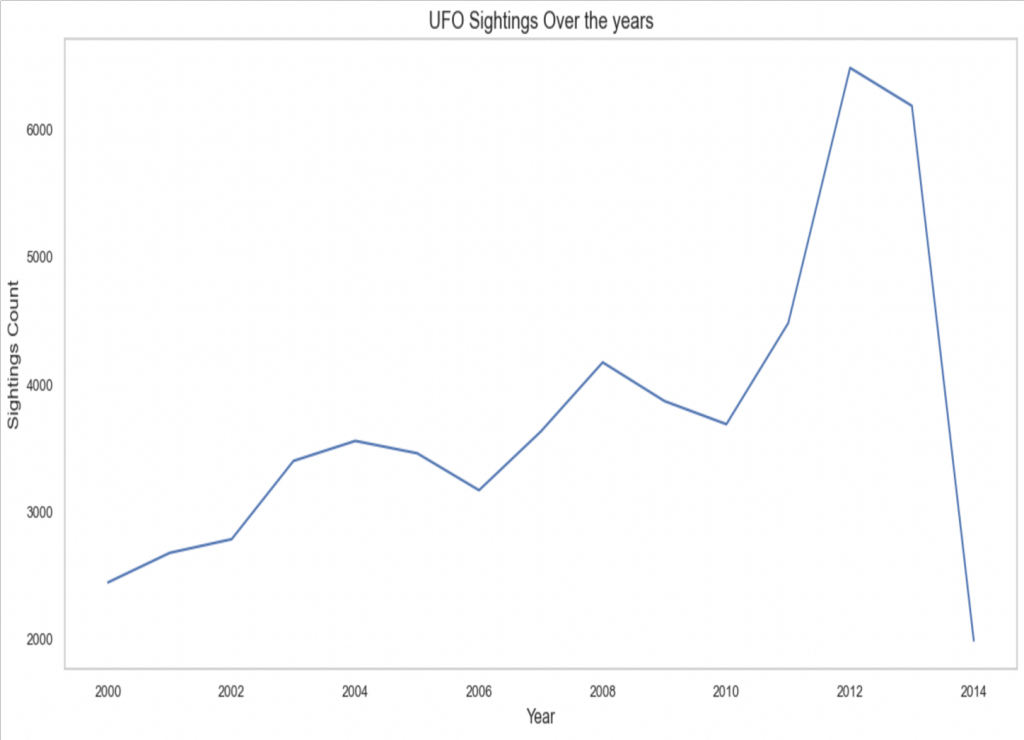
From 2000 to 2014, a captivating patterns of recurrence. appeared: sightings dip and rise every two years. This pattern could reflect media influence, changes in public awareness, or even cyclical sociopolitical factors.
This trend shows that UFO sightings aren’t just isolated events. They follow cultural rhythms. For instance, peaks often correlate with periods of heightened media coverage or political tension, suggesting that attention and anxiety may fuel both sightings and reports.
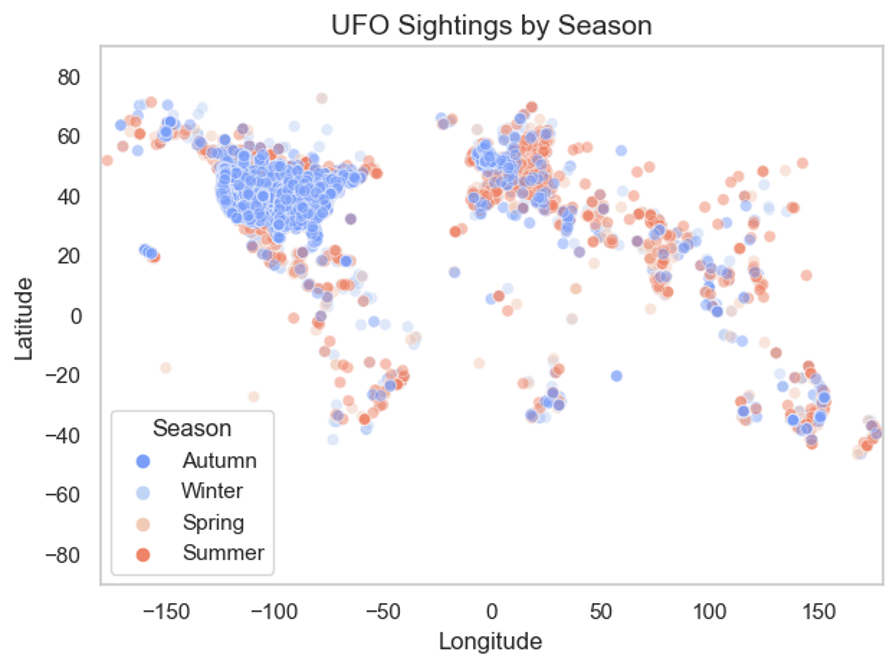
2. Geospatial Patterns of UFO Sightings.
A heatmap of sightings shows the U.S. and Europe glowing with activity. Interestingly, summer and autumn dominate as peak seasons. Is the sky clearer, or are people simply outside more? Moreover, could longer daylight hours and vacation schedules contribute to higher report rates?
The map doesn’t only show where UFOs appear. Rather, it shows reveals where curiosity is strongest—a map of curiosity. In addition, regional differences may also point to variations in cultural openness or trust in reporting systems
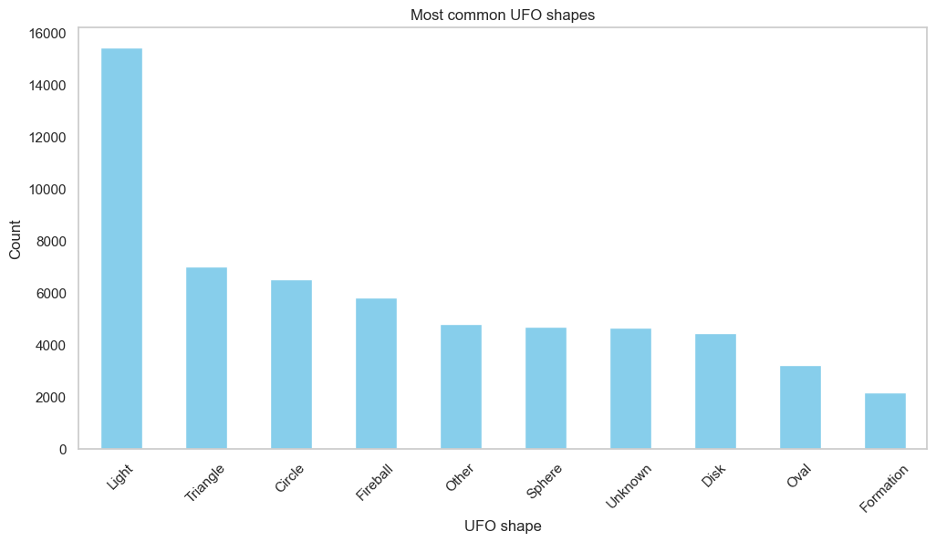
3. What Shapes Are Out There?
A bar chart reveals that « Light » is by far the most reported shape. Maybe it’s easier to see. Maybe it’s harder to categorize. Either way, it reflects how people describe what they can’t fully explain.
Shapes like « Triangle, » « Circle, » and « Fireball » follow. These hapes seem to be shaped by past experiences, visual media, or even the limits of memory and vocabulary. The rarer shapes—like « Egg » or « Chevron »—appear less, possibly limited by language and perception.
This bar chart isn’t just about objects. In other words, it’s about perception. ‘Light’ is simple, visible, and maybe too ambiguous—but it shows how people describe something they can’t quite explain.
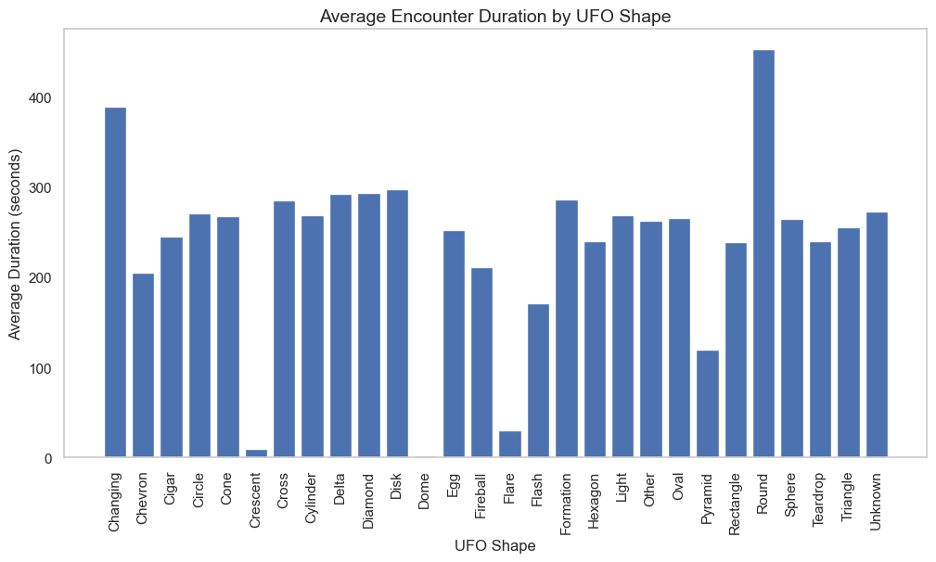
4. How Long Do They Last?
Using a log-scale box plot, we compared how long sightings lasted. In general, round objects often linger the longest, while others like flashes or fireballs are gone in seconds.
Is it about object design? Or just how we perceive time in startling moments? It’s possible that elongated sightings reflect more complex interactions or slower movement, while quicker events may be tied to atmospheric phenomena or meteors.
Duration is a window into the witness experience. It reveals, not just what was seen, but how long they had to process the mystery.
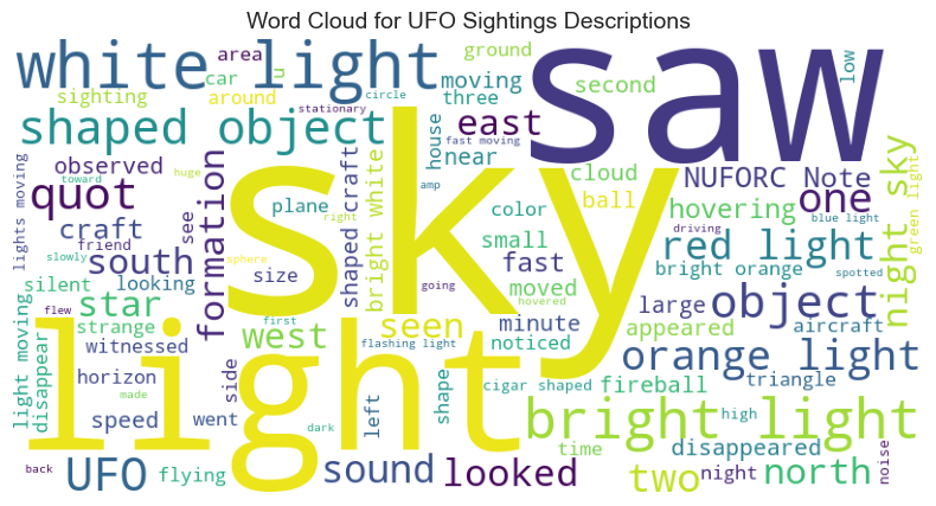
5. What Do People Say?
A word cloud built from thousands of descriptions reveals repeated words: « light, » « sky, » « object, » and « fireball. » These common terms suggest shared experiences—and shared language.
It’s as if each report echoes others. In other words, these aren’t just isolated events. They form a chorus. When language converges, it tells us something powerful: that witnesses across time and place often describe remarkably similar things.
This kind of consistency supports the idea that the phenomenon, whatever its nature, leaves a strong and memorable impression.
Final Thoughts
What would you write in a UFO report? Would you focus on the color, the feeling, or the way it moved?
Data can’t prove what’s real in the sky. However, it can prove what’s real in us: curiosity, consistency, and the desire to understand the unknown.
These visualizations aren’t just about data. Rather, they’re about how we describe the indescribable. They’re about the search for meaning when confronted with the extraordinary.
Behind every point on a graph is a person who saw something and felt compelled to speak up.
Future Research
This analysis opens doors for deeper studies:
Sentiment analysis of UFO descriptions to explore emotional responses.
Clustering to find patterns in time and geography.
Cross-cultural comparisons of reporting habits.
Correlation with external events like military activity or movies.
Temporal comparison of language used across decades to detect shifts in cultural interpretation.
As long as we keep looking up, there will always be questions. Thus, through data, maybe one day we’ll find some answers.