Introduction
Where Your Subconscious Throws a Party and Logic Isn’t Invited
Let’s be honest — dreams are basically your brain’s late-night experimental theater. No script. No logic. Just vibes.
One moment you’re being chased by a giant croissant, the next you’re giving a TED Talk in your pajamas to a room full of cats. And somehow, it all feels meaningful. Because it is. Dreams are your subconscious mind’s way of putting on a show — abstract, emotional, symbolic, and endlessly weird.
But what if these midnight stories weren’t just nonsense?
What if they were data?
What if your flying-anxiety-spaghetti nightmare had meaning — and not just for your therapist?
Welcome to Dream Chronicles: where we turn bizarre brain bloopers into stunning data visualizations. Through emotion analysis, symbolic mapping, and cross-cultural dream patterns, we expose the architecture of the unconscious mind — decoding the hopes, fears, and recurring cameos (why is your ex always there?!) that make up our shared nocturnal adventures.
This isn’t just dream analysis. It’s a deep dive into humanity’s collective sleep-parade — powered by data science, storytelling, and a good dose of curiosity.
Spoiler alert: there will be snakes, teeth falling out, and a lot of running…

About the Project: Dream Data Meets Data Science
This project, « Dream Chronicles, » uses advanced data visualization and natural language processing to explore a dataset of dreams. The goal? To identify the most common dream symbols, emotions, and patterns by country, gender, and frequency — offering deep psychological insights and cultural interpretation.
The Data Behind Our Dreams
At the heart of this project is a dataset of around 30,000 real dream entries, sourced from Kaggle, blending real and AI-generated dreams from forums and journals. Each entry is rich with metadata, including:
- Primary emotions (Fear, Joy, Anticipation, Sadness, etc.)
- Sentiment scores (Positive, Negative, Neutral)
- Demographic details (Age, Gender, Country)
- Dream clarity (Vivid, Foggy, Abstract)
By applying natural language processing (NLP), we analyze both the emotional tone and symbolic content of these dreams — transforming subjective stories into measurable insight.
Preprocessing & Analysis
- Cleaned text for clarity and consistency
- Detected emotions using VADER and NRC lexicons
- Clustered themes around common symbols (e.g., falling, flying, snakes)
- Segmented data by country, gender, and age to spot patterns
Key Visualizations & Insights
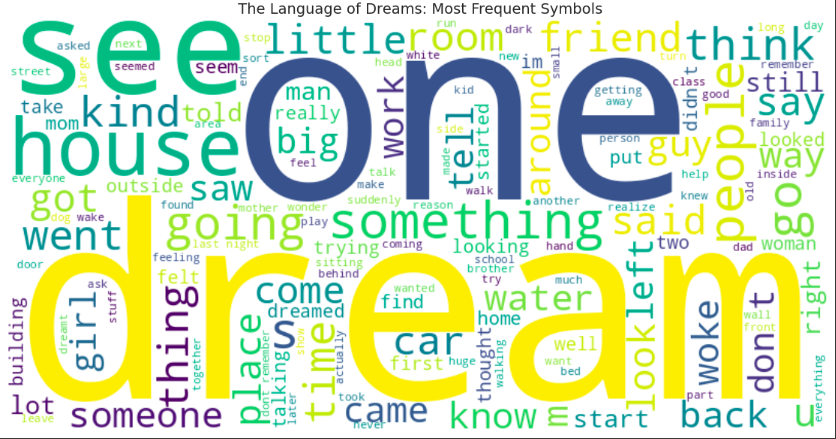
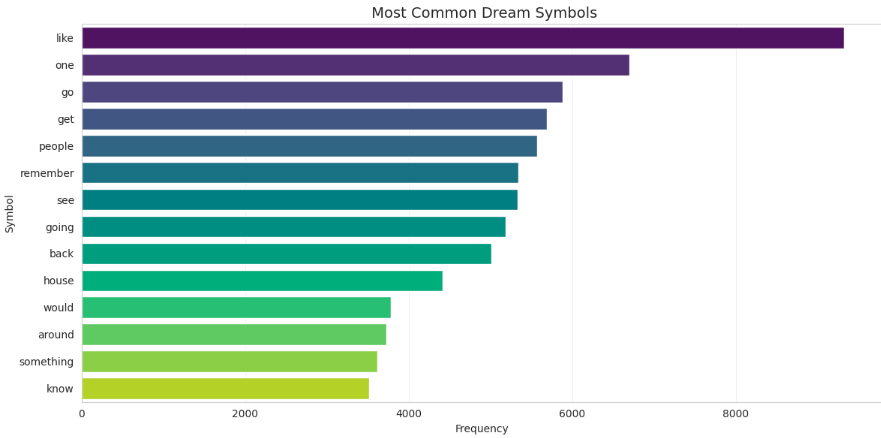
Here are the visualizations that bring the data to life—uncovering hidden patterns, emotional trends, and symbolic connections within our dreams:
- Word Cloud & Bar Charts: Most common terms include “dream,” “see,” “house,” and “someone” — reflecting shared symbolic language
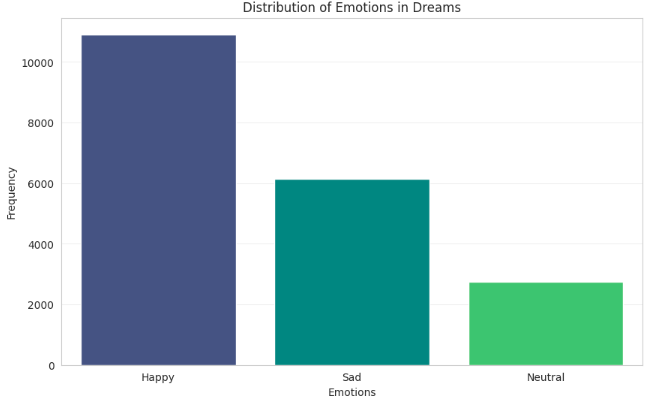
- Emotion Distribution: Happiness leads, followed by sadness and neutral tones
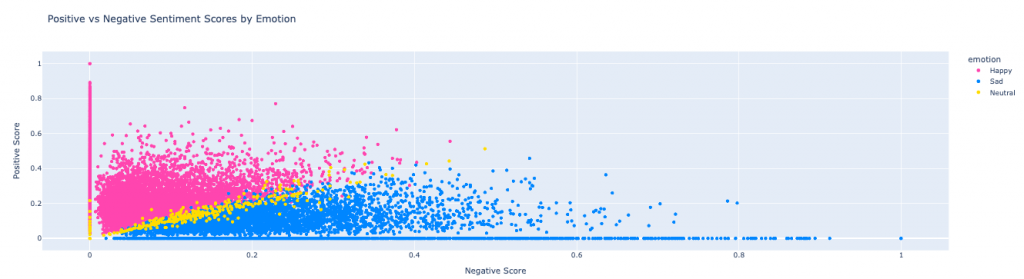
- Sentiment vs. Emotion Scatter Plot: Happy dreams score high on positivity; sad dreams show deeper emotional complexity
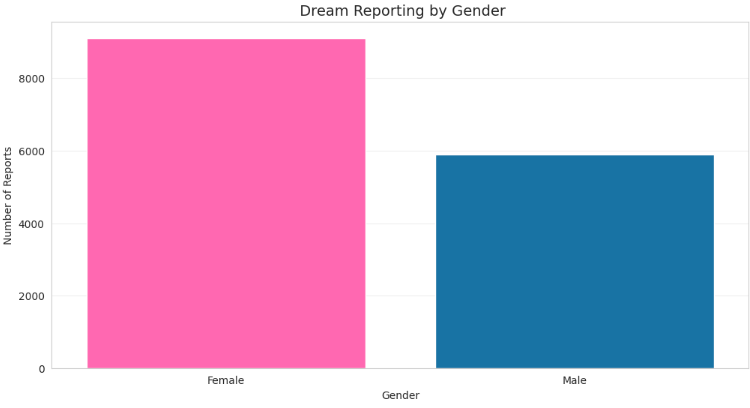
- Gender Dream Report Rates: Females report more dreams, possibly due to recall or cultural norms
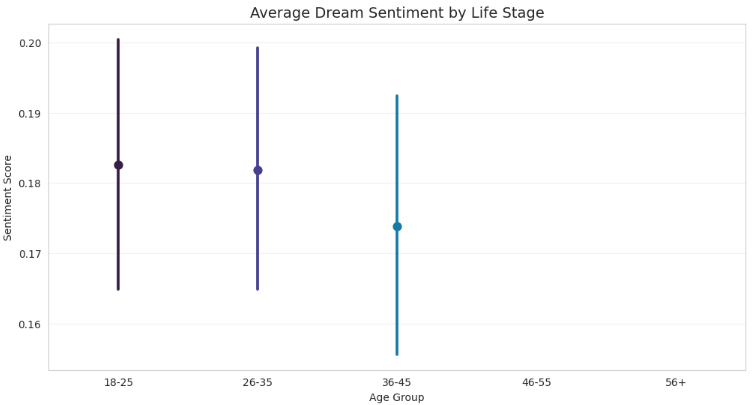
- Age vs. Positivity Line Chart: Positivity declines steadily with age
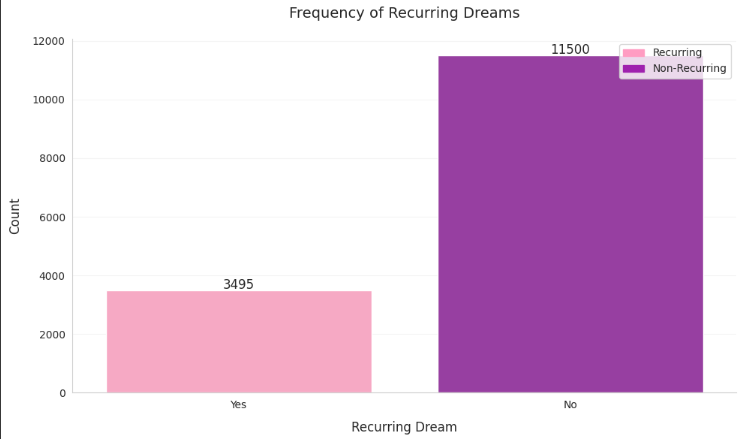
- Recurring vs. Non-recurring Barplot: Non Recurring dreams vastly outnumber recurring ones
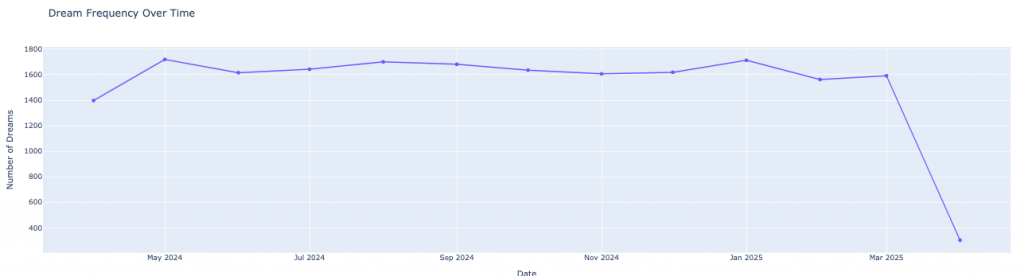
- Seasonality in Dream Reporting: Spikes in January and May
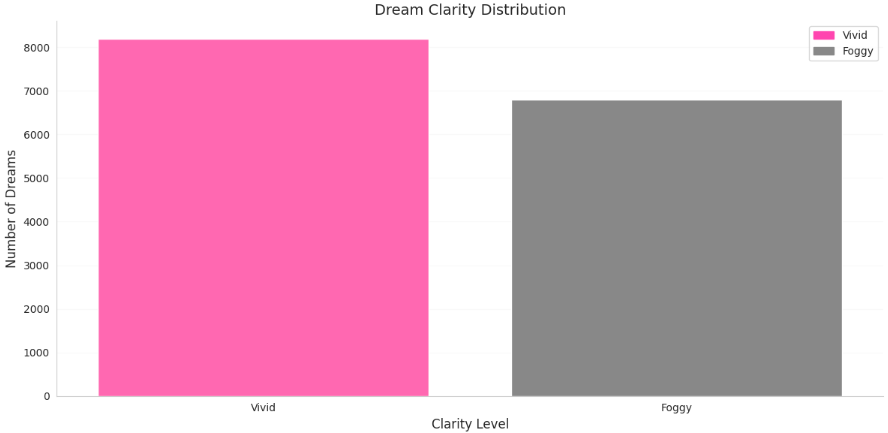
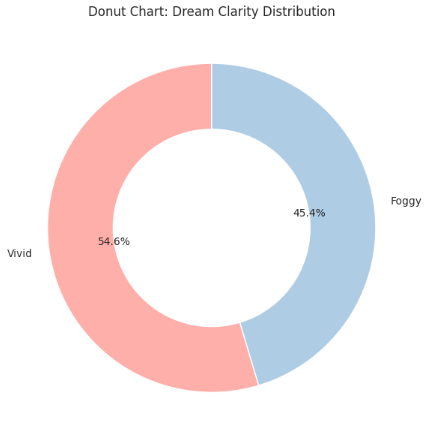
- Vivid vs. Foggy Dreams: Vivid dreams dominate, suggesting deeper emotional imprint
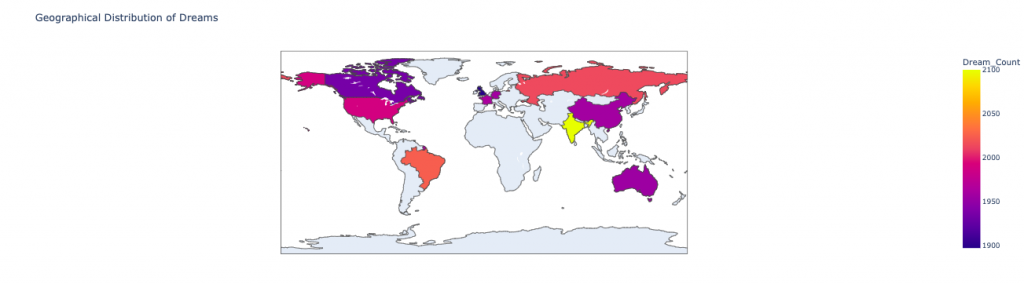
- Choropleth Map: Cultural values shape dream reporting intensity
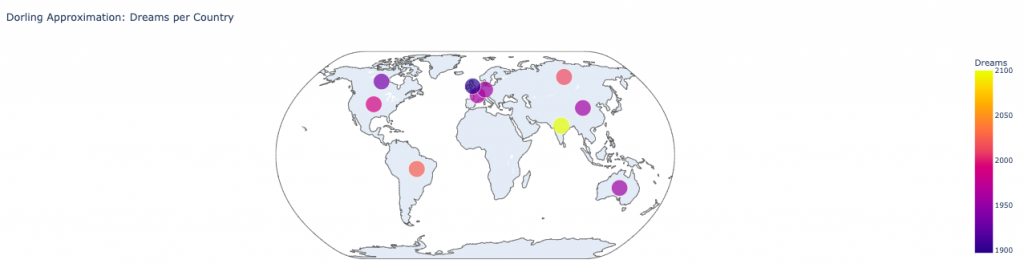
- Dorling Cartogram: Dream volume visualized by country using symbolic circles
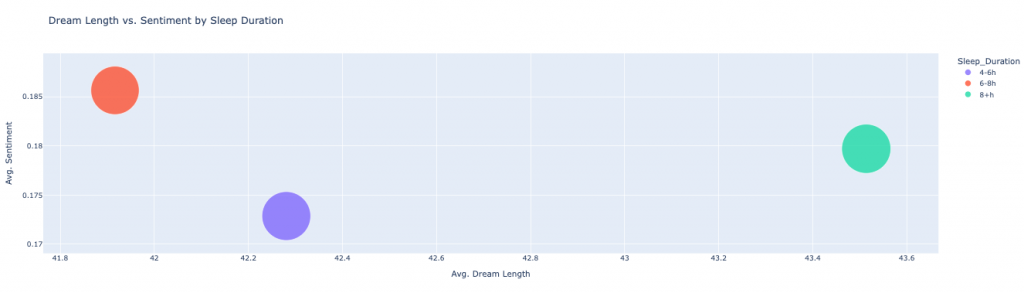
- Bubble Chart: Longer sleep doesn’t always mean happier dreams
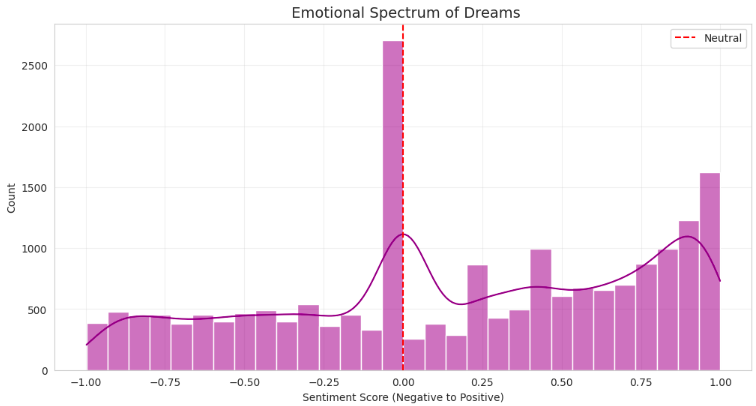
- Bimodal Histogram: Dreams split into emotionally moderate vs. extreme
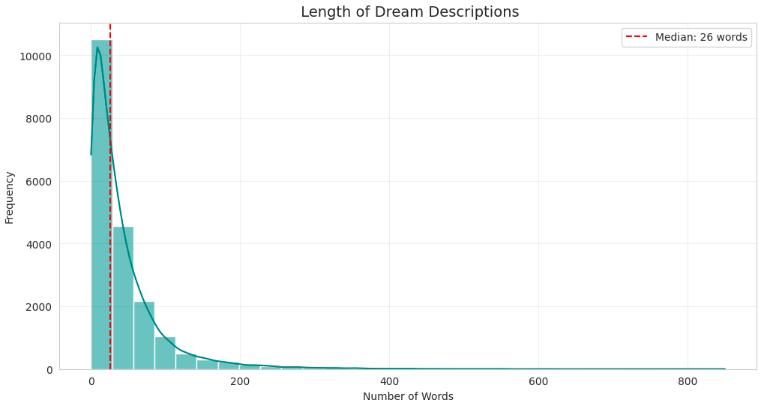
- Histogram on Dream Length: Most people stop writing dreams after 26 words
- Animated Bar Chart: Dream sentiment across country and age
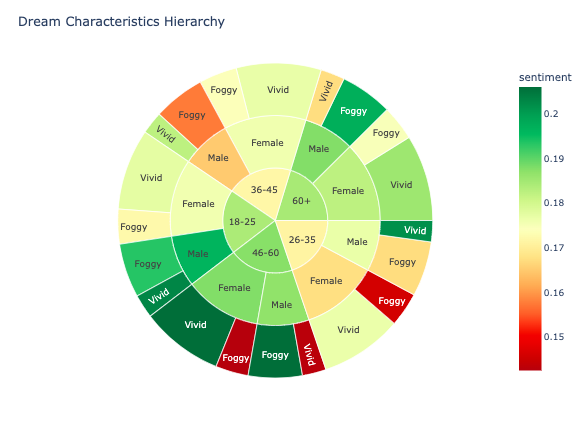
- Sunburst Chart: Vividness, demographics, and emotion connections
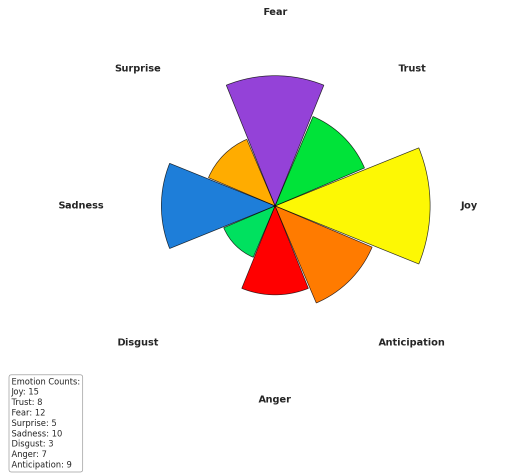
- Radar Chart: Joy dominates, but fear and sadness are major players too
Conclusion
Through the lens of data visualization, ‘Dream Chronicles’ offers a unique perspective on the intricate world of dreams, transforming subjective narratives into quantifiable data. Our analysis reveals recurring dream symbols and emotional patterns, highlights the influence of demographics and cultural factors on dream experiences, and underscores the complex interplay between dream characteristics and sentiment.
Ultimately, this exploration proves that data science can do more than inform—it can reveal the poetry hidden in our minds, offering a rare glimpse into the silent language of our inner worlds.
So tonight, when you drift off to sleep, remember — your dreams aren’t just stories. They’re data points waiting to be discovered, tiny messages from your subconscious, just waiting to be charted.
Sweet dreams, and may your subconscious surprise you!
References:
- https://doi.org/10.1037/10638-000
- https://ojs.aaai.org/index.php/ICWSM/article/view/14550
- https://www.kaggle.com/datasets/sarikakv1221/dreams
