Visa applications are not only about individual qualifications but are also deeply influenced by patterns such as geography, education, and employer characteristics. Through a series of visualizations, we uncover the key factors that shape visa approval trends. This narrative walks through key insights derived from a comprehensive dataset of US employment visa applications.
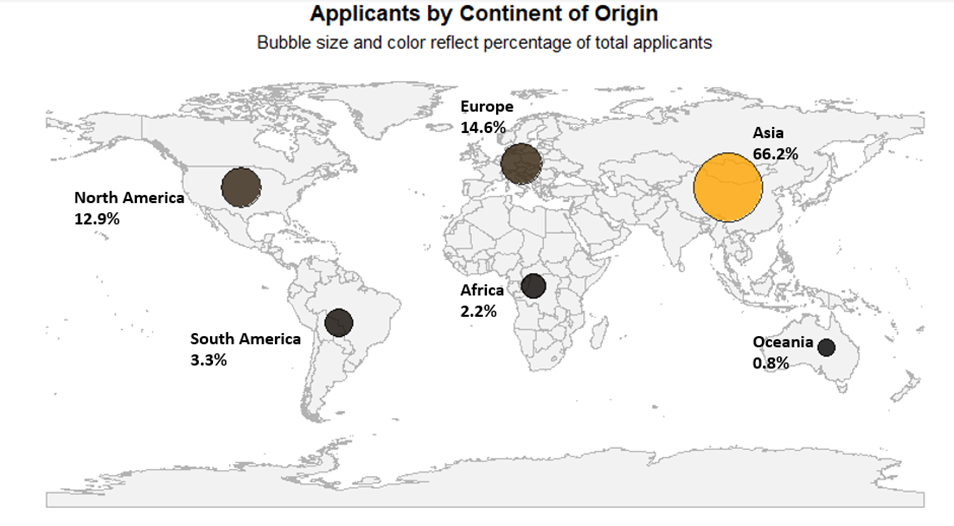
The global landscape of work migration comes alive when we trace the origins of applicants hoping to build their futures in the United States. A world map dotted with proportional bubbles reveals that the majority of these individuals hail from Asia, followed by substantial numbers from Europe.
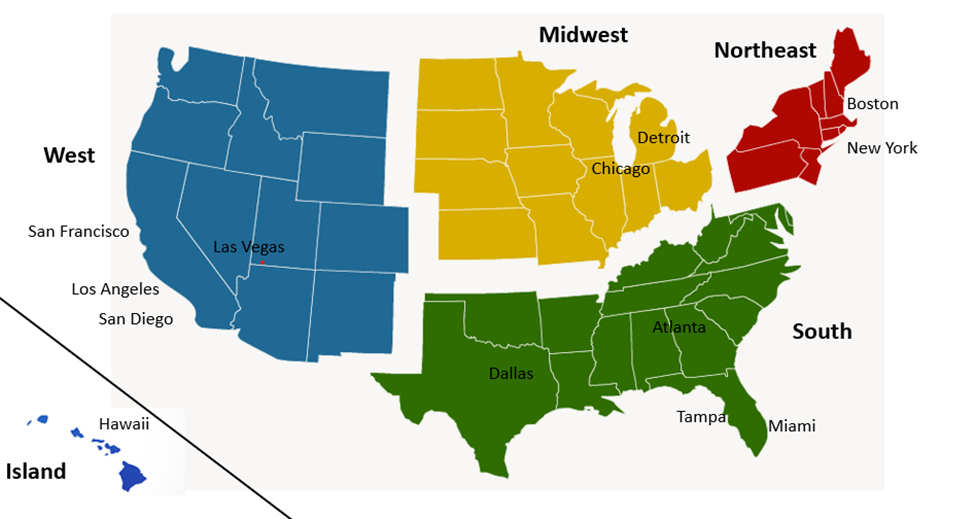
To better understand where these applicants might be applying for work within the U.S., we present a map outlining the regions of the country. This map serves a foundational purpose, familiarizing readers with the geographic zones referred to throughout the article: the West, South, Northeast, and Midwest.
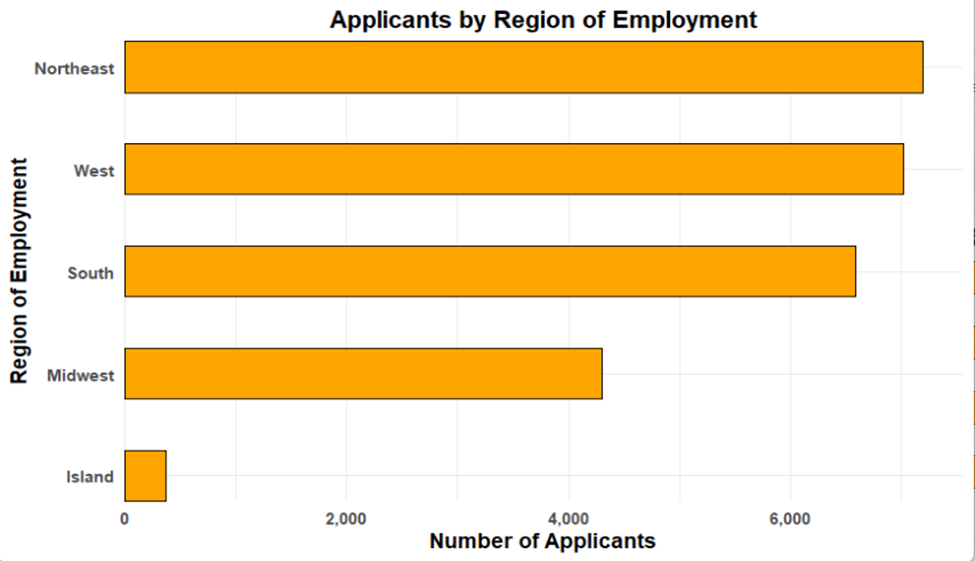
Shifting focus from continents to U.S. regions, a horizontal bar chart displays the distribution of applicants by region of employment. Here, the Northeast stands out as the most common destination, followed closely by the West. These insights suggest regional trends in labor demand, possibly shaped by industry concentrations or immigration-friendly policies at the local level.
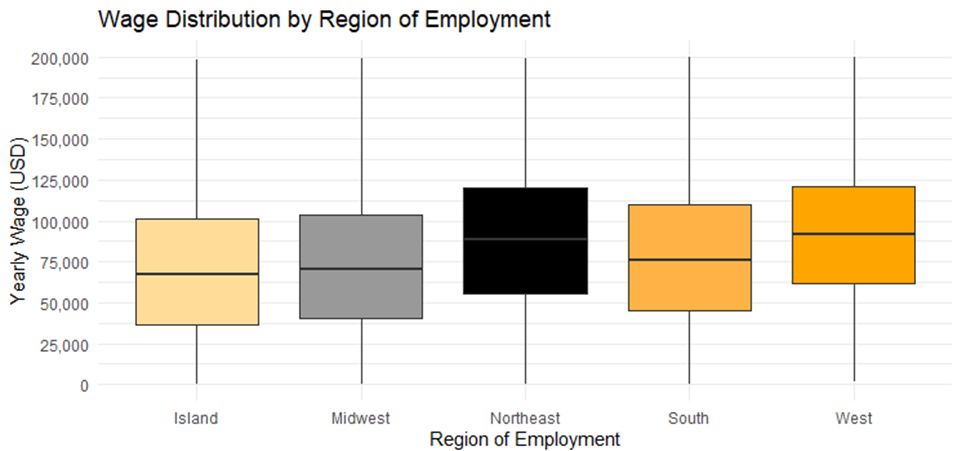
But it isn’t just about where people are going—it’s also about how much they earn. A boxplot exposes the wage distribution across these same regions. The West and the Northeast, show higher median wages, hinting at competitive job markets.
The West, long recognized as the cradle of innovation, hosts many of the world’s leading technology firms, making it a magnet for skilled applicants in tech-driven roles. Meanwhile, the Northeast, with its strong legacy in finance and corporate headquarters, continues to dominate sectors like banking and consulting — attracting a distinct applicant profile aligned with those industries.
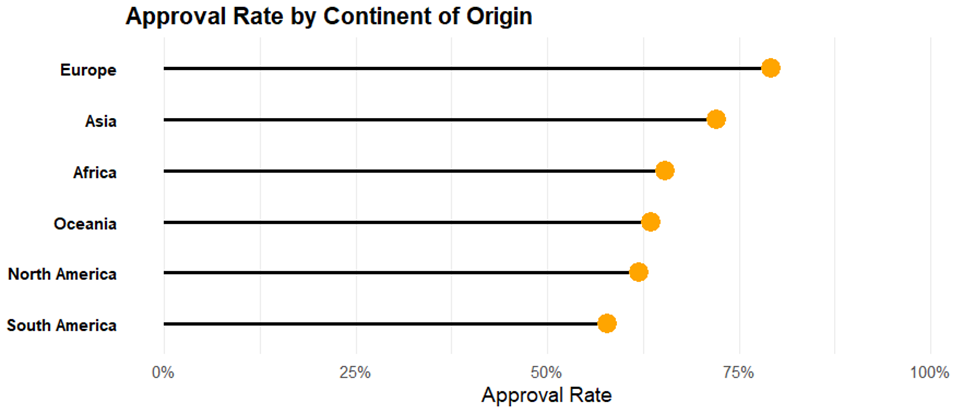
Turning our attention back to origin, a vibrant lollipop chart explores the approval rate by continent. Here, Europe and Asia lead with the highest certification rates. This introduces questions around the systemic or procedural factors influencing these results, setting the stage for a deeper dive into applicant attributes.
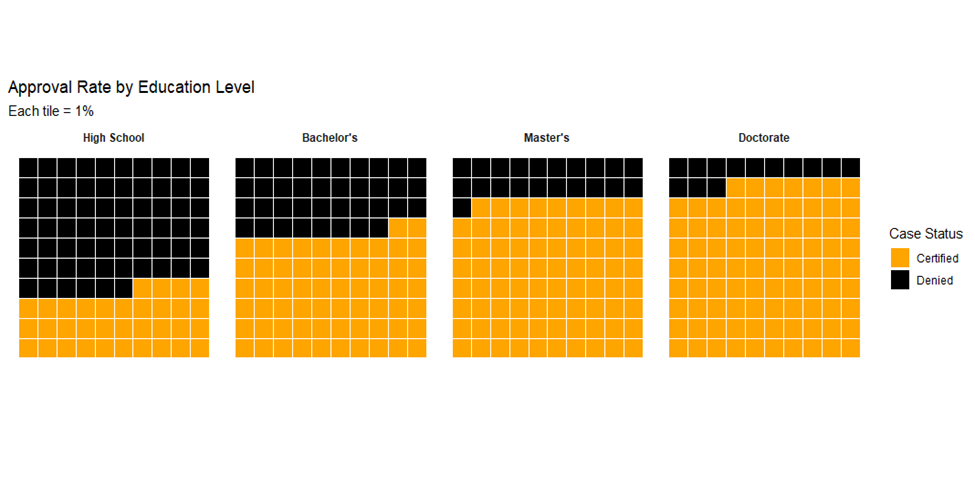
Education, as it turns out, plays a defining role. A creative waffle chart, made of colored tiles, presents the approval rates for different education levels. Certified cases dominate for Doctorate and Master’s degree holders. As the education level drops, so too does the approval rate, with high school graduates experiencing a notably lower share of success. This pattern reinforces the premium placed on advanced qualifications in the U.S. labor certification process.
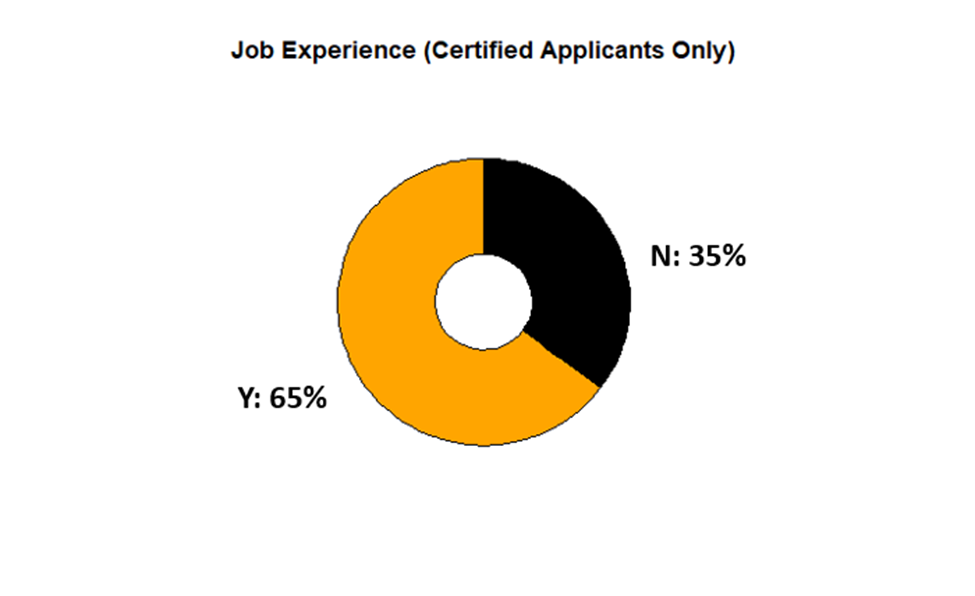
Another critical factor is job experience. Focusing only on certified applicants, a donut chart reveals that a majority report having prior job experience. With one bold orange slice for “Yes” and a much smaller black slice for “No,” the visual clearly indicates the weight employers place on proven skills and history.
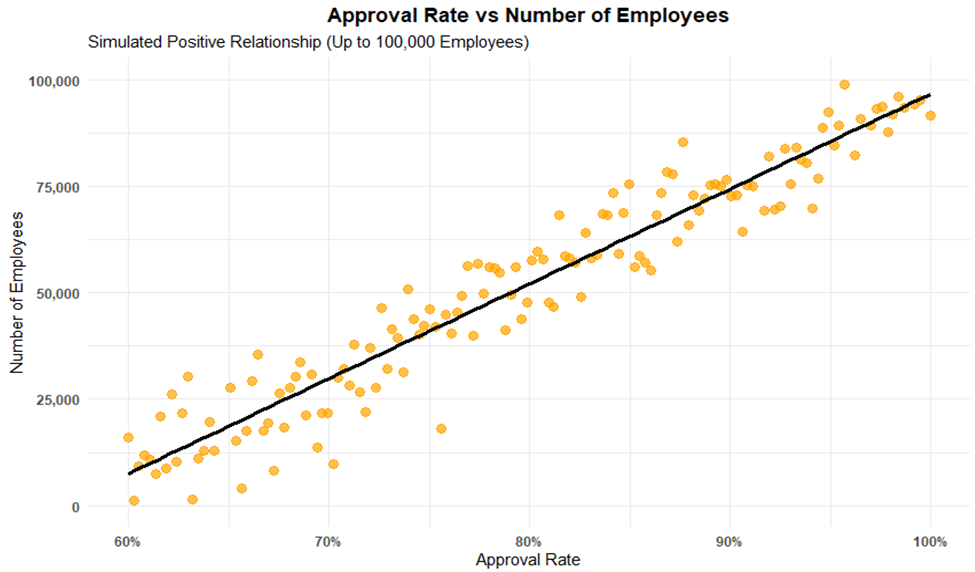
Lastly, we explore how company size may impact approval rates. A clean scatter plot with a positive trendline illustrates that as the number of employees increases, so does the likelihood of visa approval. Larger companies, with more resources and experience navigating immigration policies, appear better positioned to support successful applications (Google, Meta, Amazon, Tesla…)
This closing insight links organizational capacity to applicant success, giving us a view of what drives visa approval in the United States.
Altogether, the data paints a clear picture of how geography, experience, and company profile intersect in shaping visa outcomes. From the global reach of applicants to regional industry strengths, and from the value of job experience to the influence of company size, each factor tells a part of the story. As policies and global mobility continue to evolve, these insights offer a look into the dynamics of opportunity — and who is most likely to seize it.
References:
