Roulette is a game of chance, suspense, and for some, strategy. Assuming fair play and an unbiased wheel, how do popular betting systems perform when evaluated through data? This data visualization project explores the performance of roulette strategies through a structured analysis of game outcomes.
The Dataset
The dataset logs each roulette round: the winning number, its color, and binary indicators for whether bets on red, black, even, odd, or zero succeeded.
Example:
| Round | Winning Number | Winning Color | Red Bet Win | Black Bet Win | Even Bet Win | Odd Bet Win | Zero Bet Win |
| 1 | 22 | Black | 0 | 1 | 1 | 0 | 0 |
| 2 | 8 | Black | 0 | 1 | 1 | 0 | 0 |
| 3 | 33 | Black | 0 | 1 | 0 | 1 | 0 |
Basic Statistics:
First, some basic statistics are explored to establish a foundational understanding of outcome distributions and to assess whether the outcomes align with the expectations of a fair game.
To begin, the basic distributions of roulette outcomes are examined—specifically the frequency of winning colors and parity (even vs. odd).
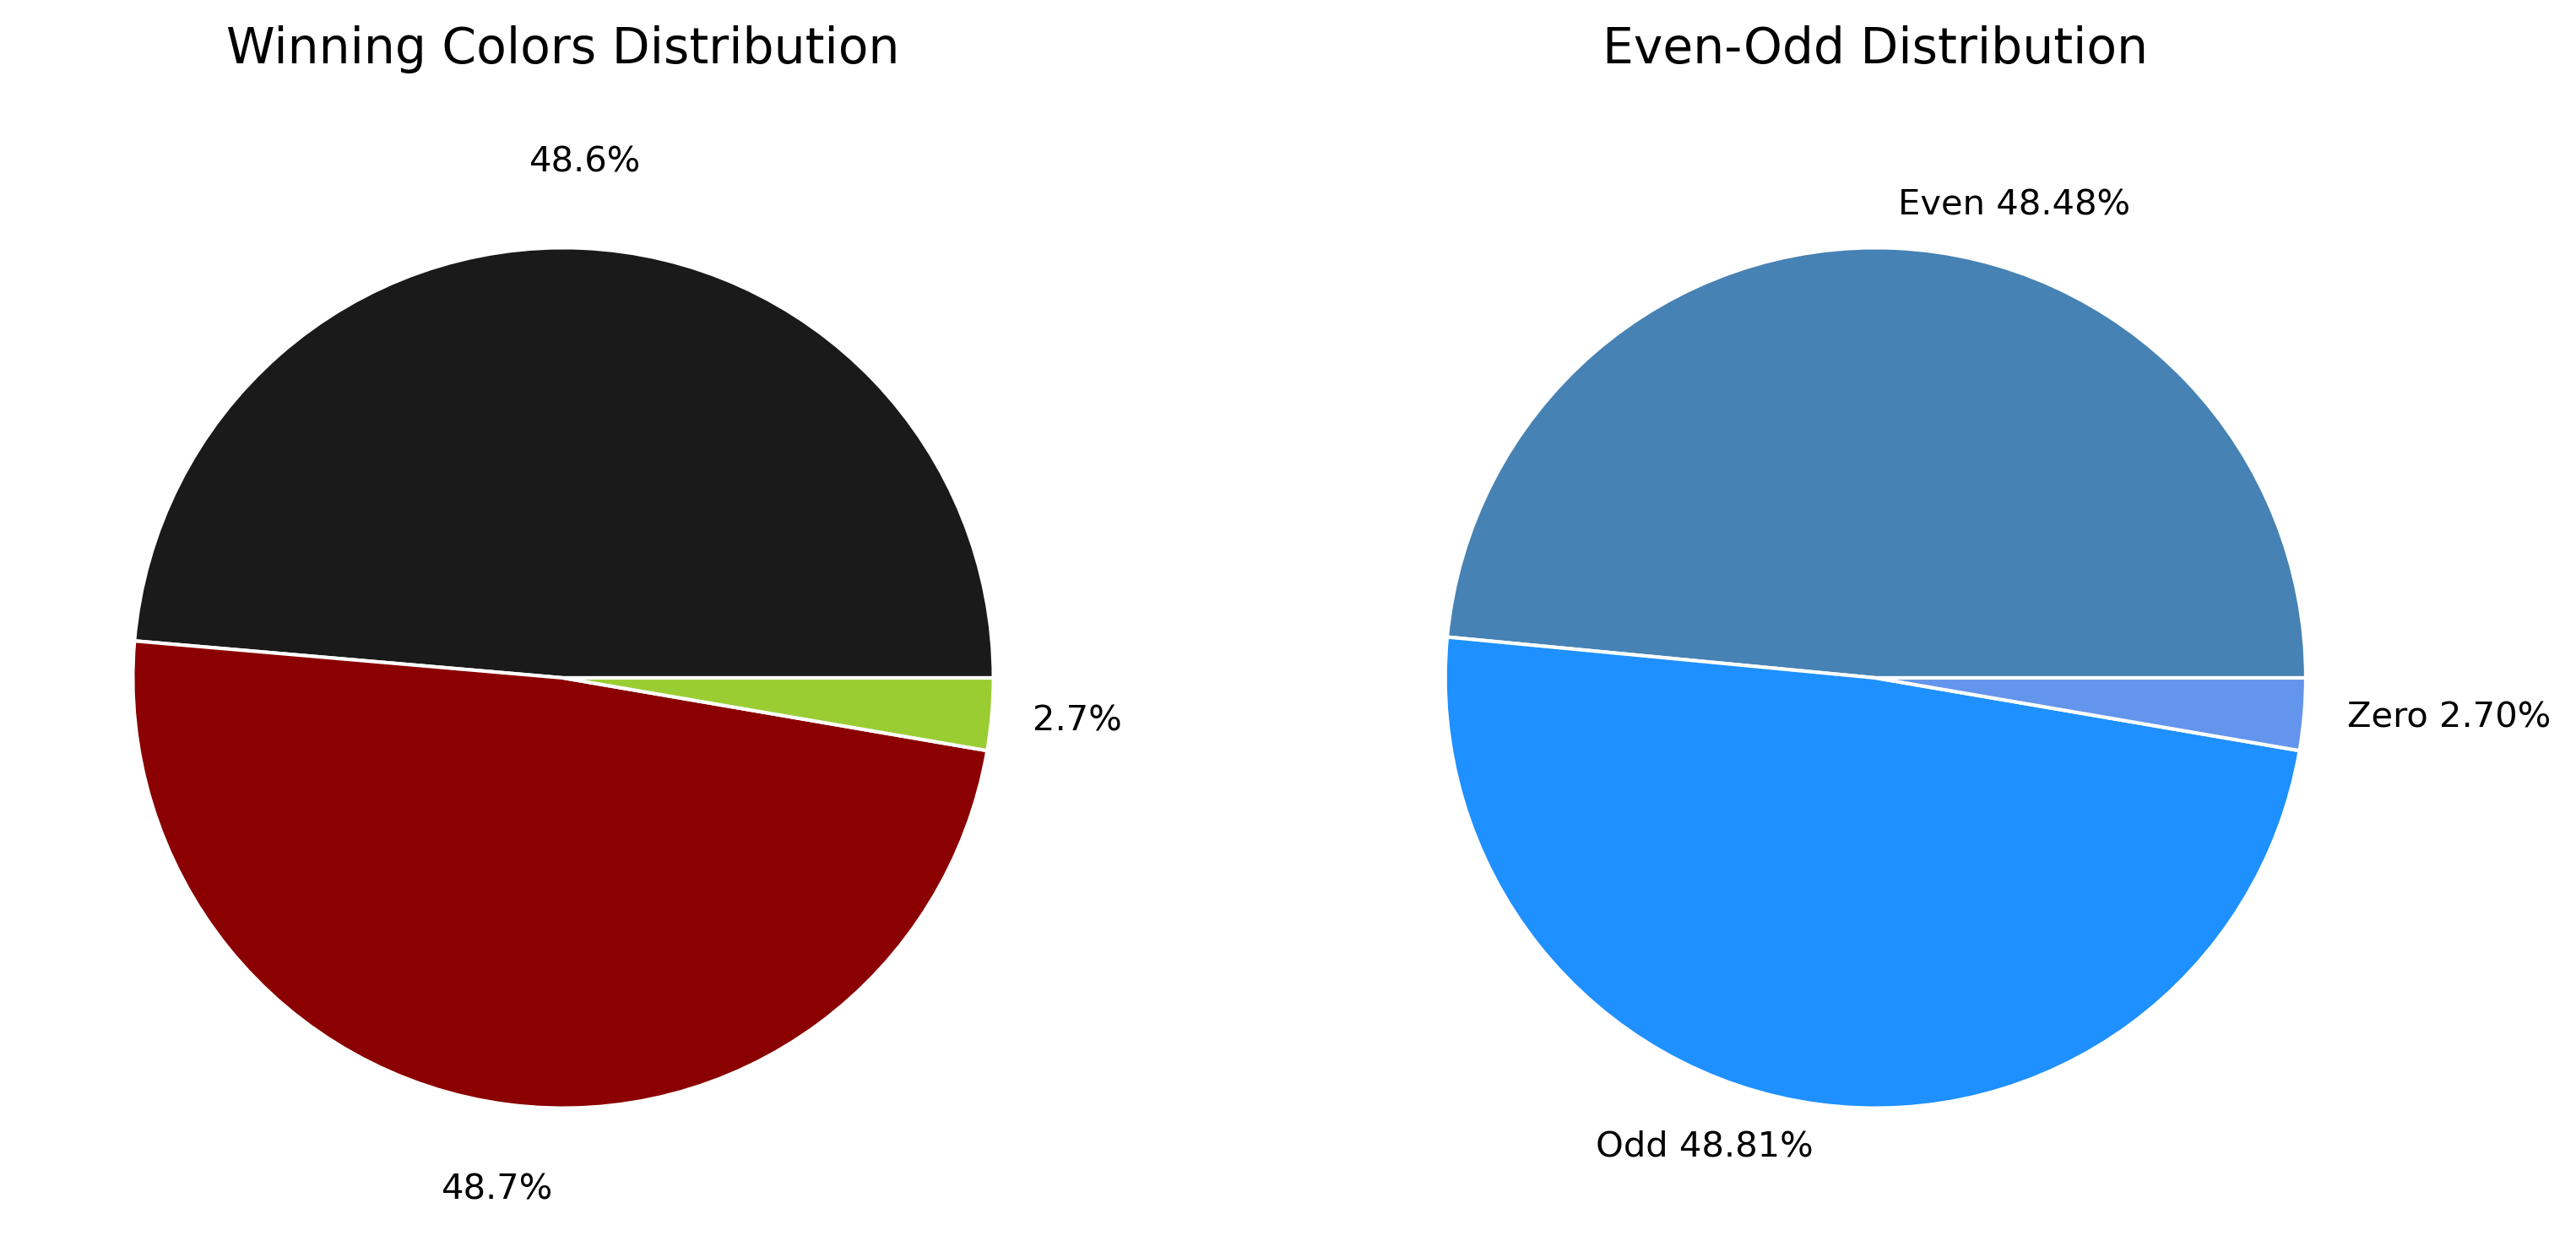
As shown, red and black outcomes occur with nearly equal probability, and even/odd results are similarly balanced.
Next, the frequency of each individual number is analyzed and compared to the theoretical average expected in a fair game.
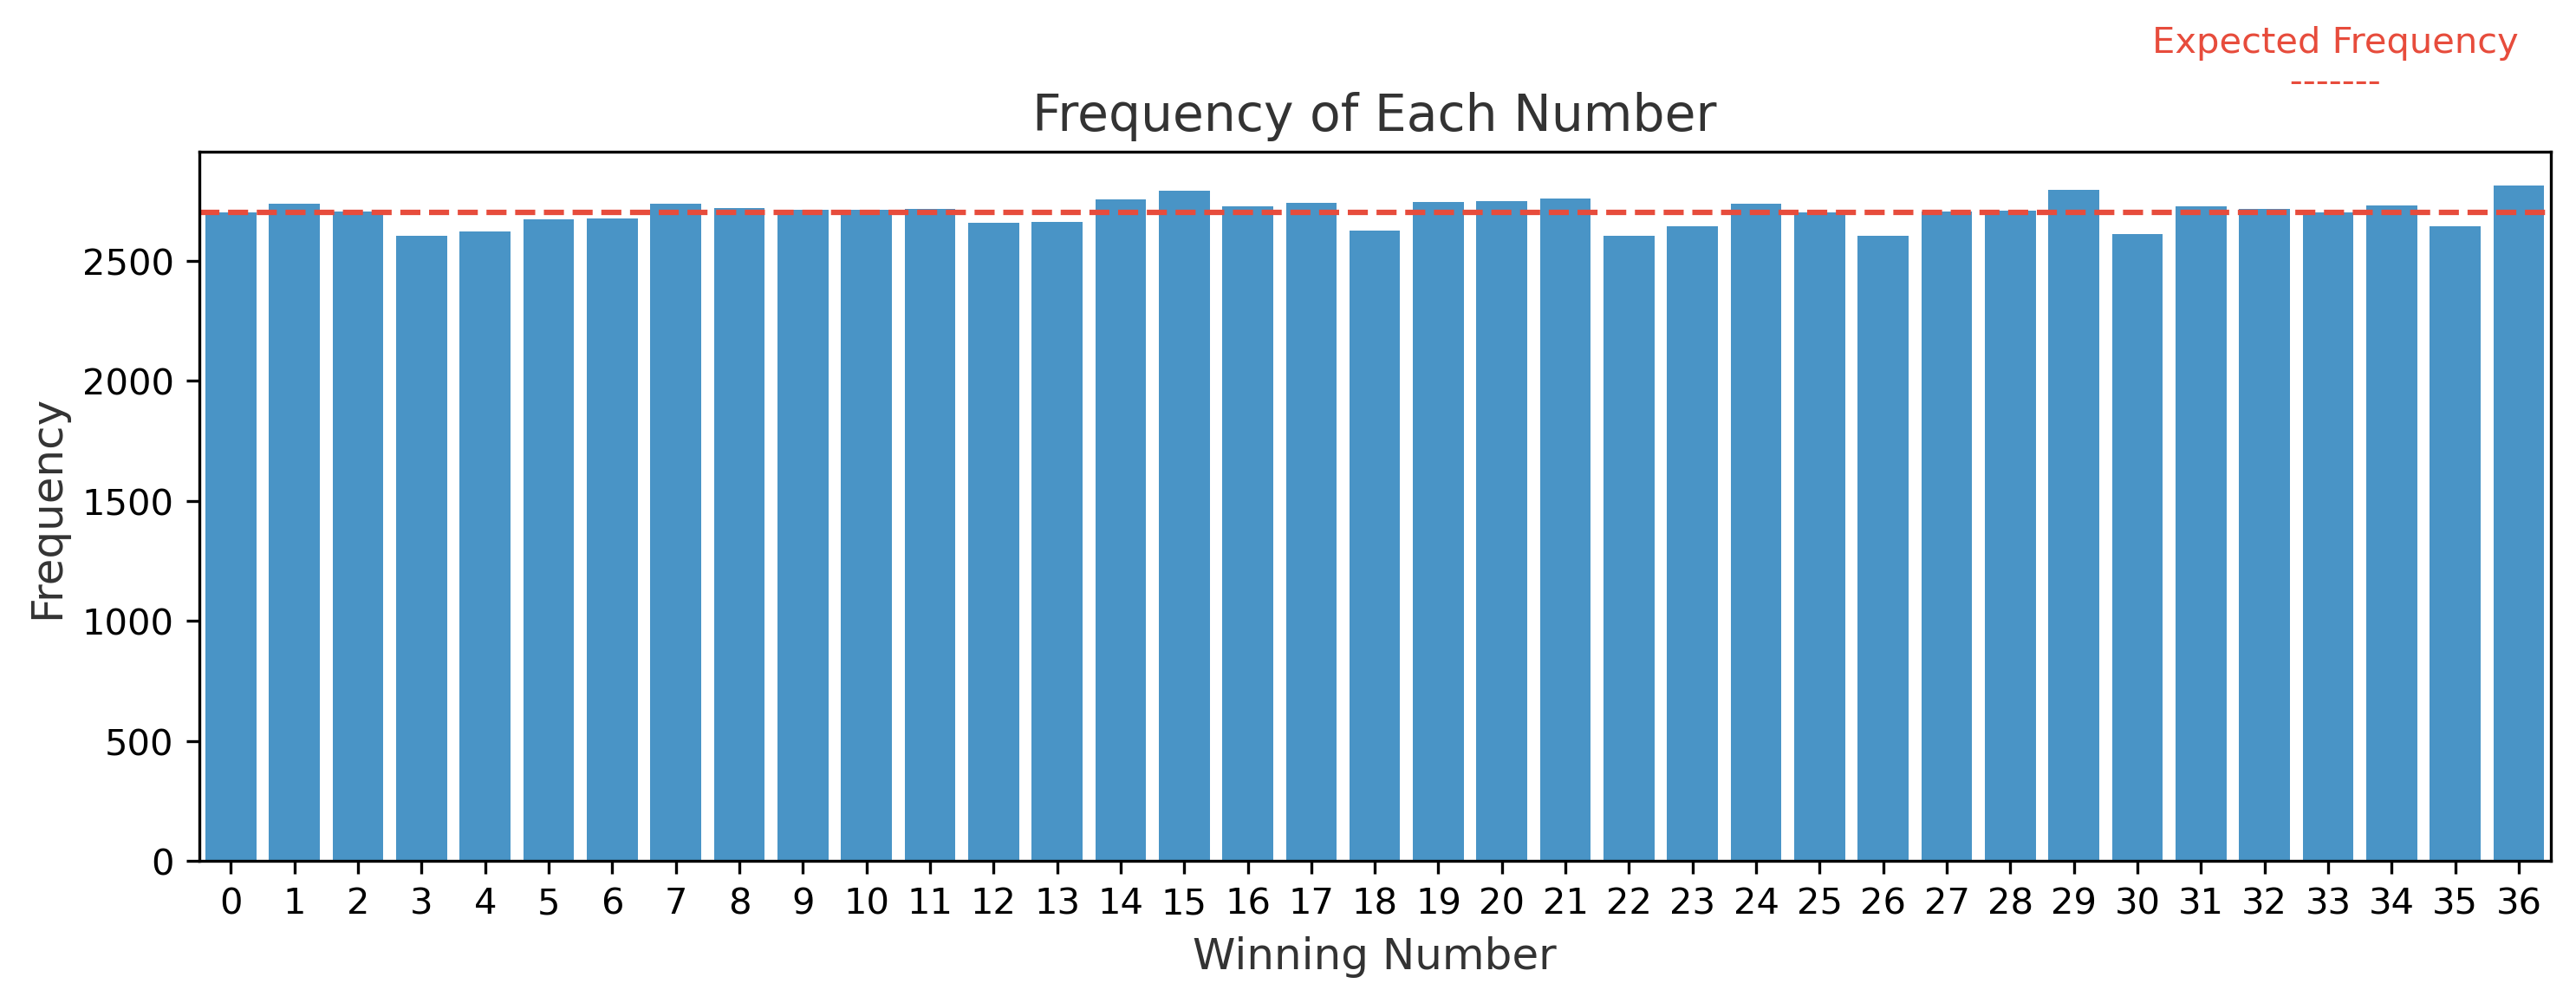
While minor variations exist, the distribution aligns closely with the expected frequency. No number seems to be playing favorites—unfortunately for superstitious players.
To explore possible patterns, number-to-number transitions were analyzed.
The heatmap shows a uniform distribution, with no clear trends or repeated sequences. However, a closer look at the most frequent transitions can highlight rare but interesting coincidences.
The top transitions stand out slightly but remain within the range of random variation.
Next, the frequency of streaks by color is analyzed to understand how often consecutive wins for red or black occur.
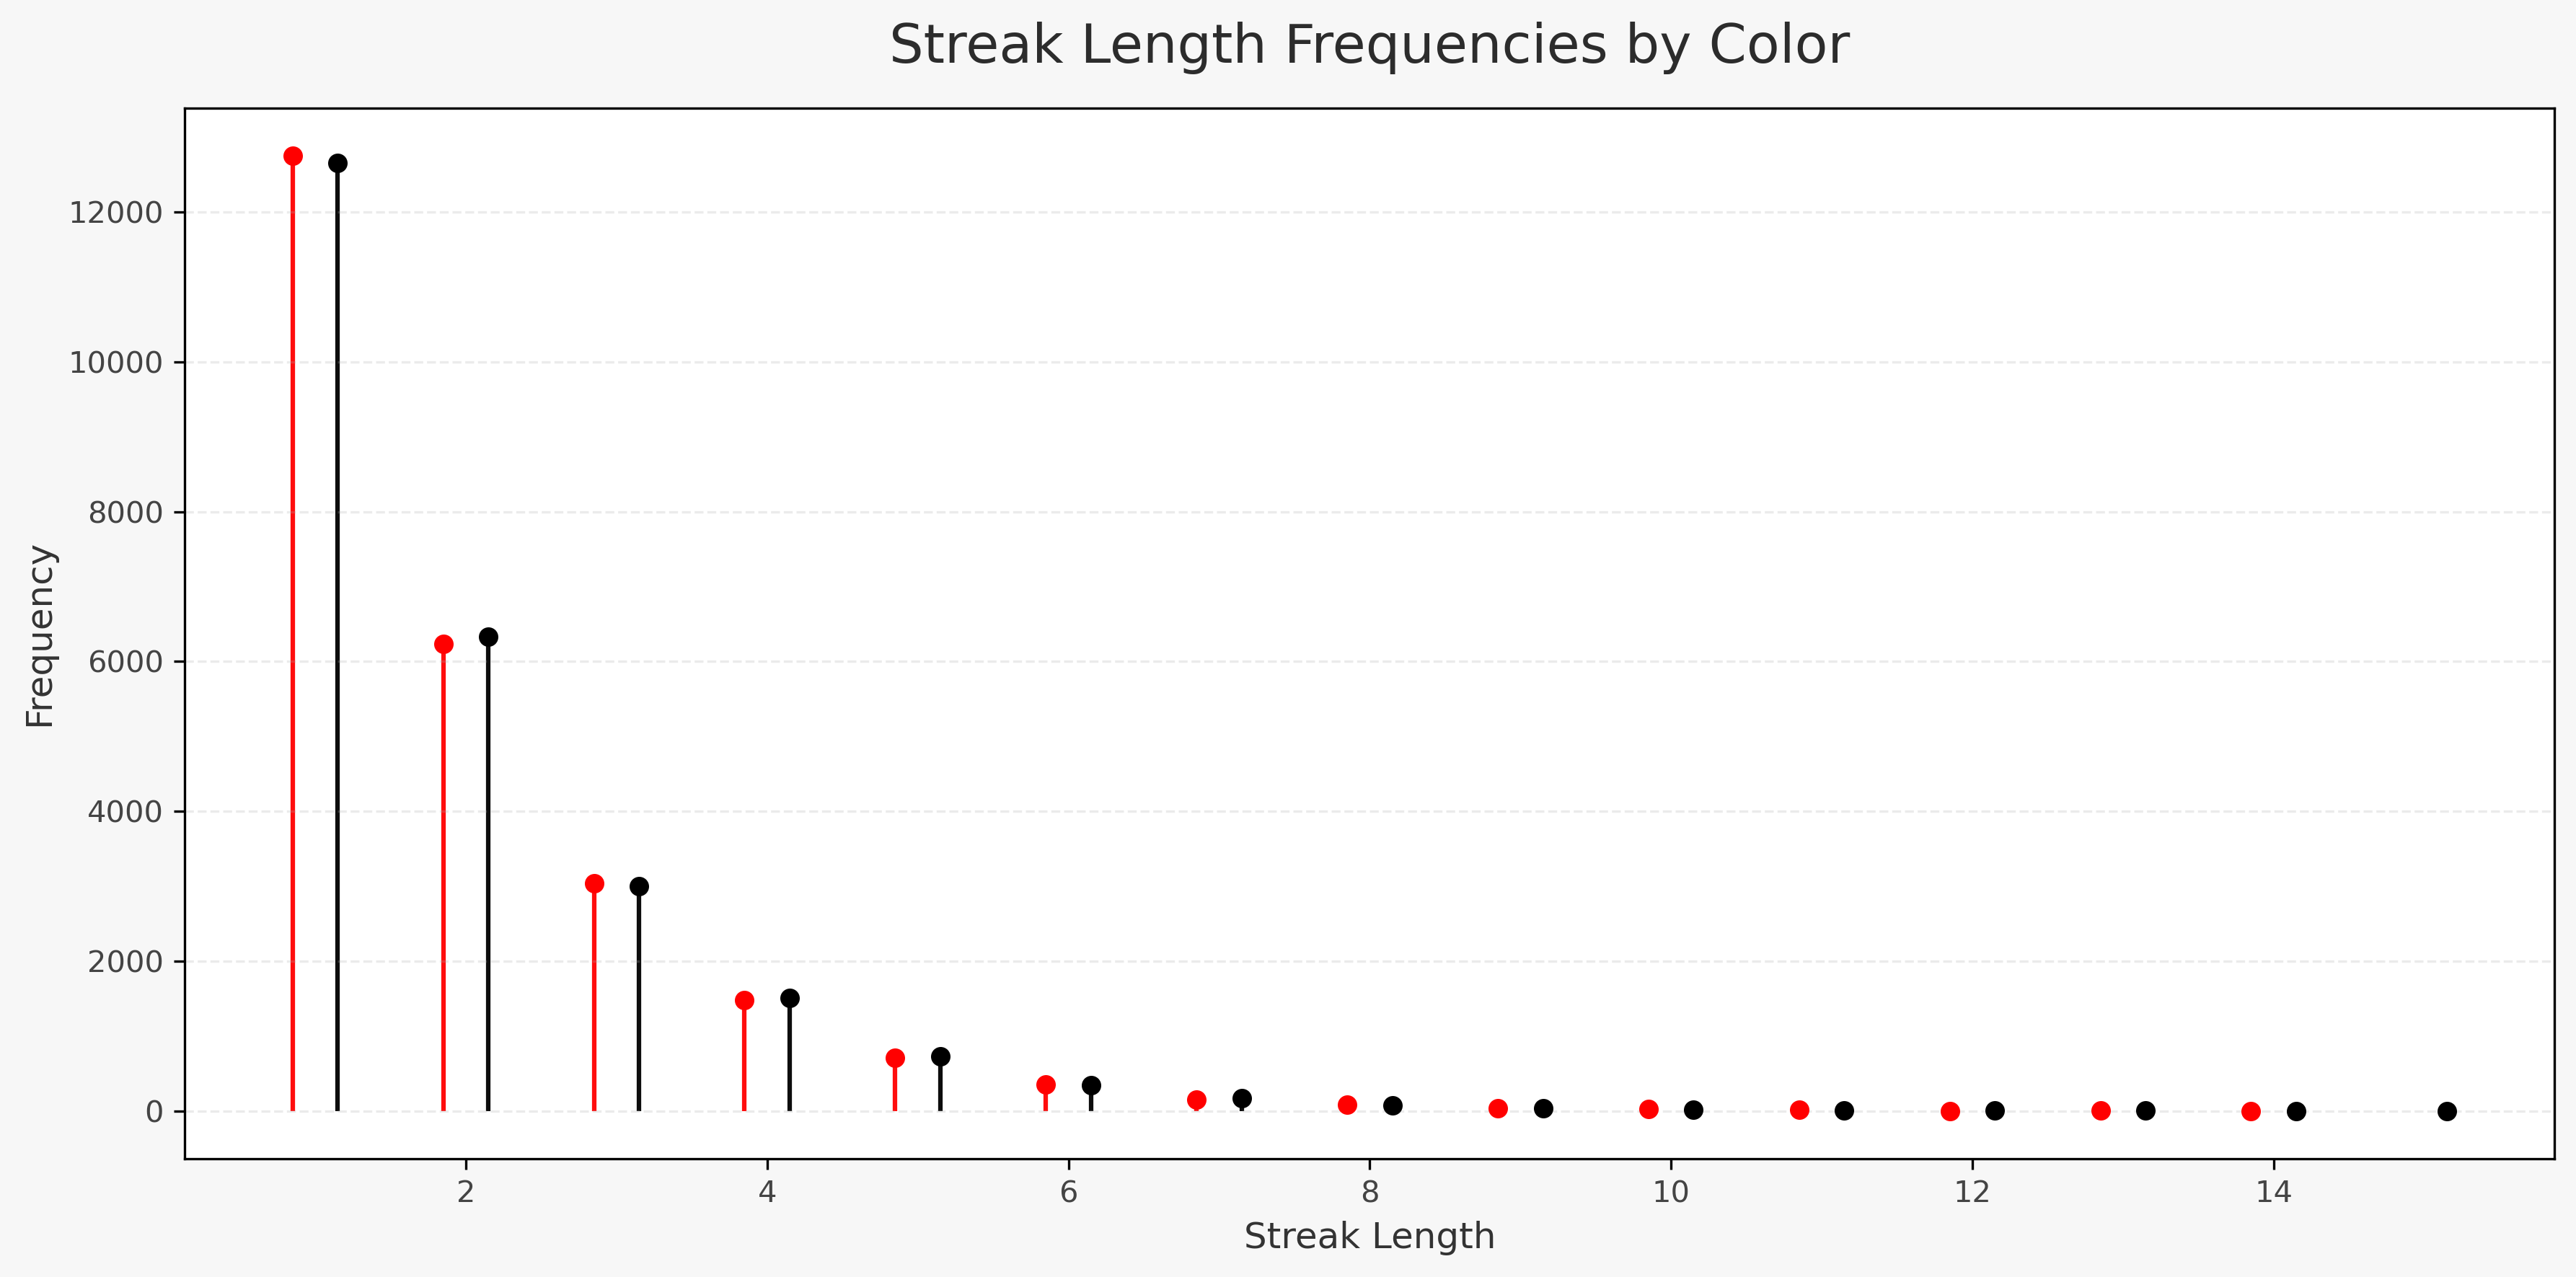
As expected in random sequences, short streaks are most common and longer streaks become increasingly rare. This aligns with the natural behavior of independent outcomes.
Streak analysis shows that longer runs of the same color do happen, though less frequently. This raises the question: does a long streak affect the outcome of the next spin?
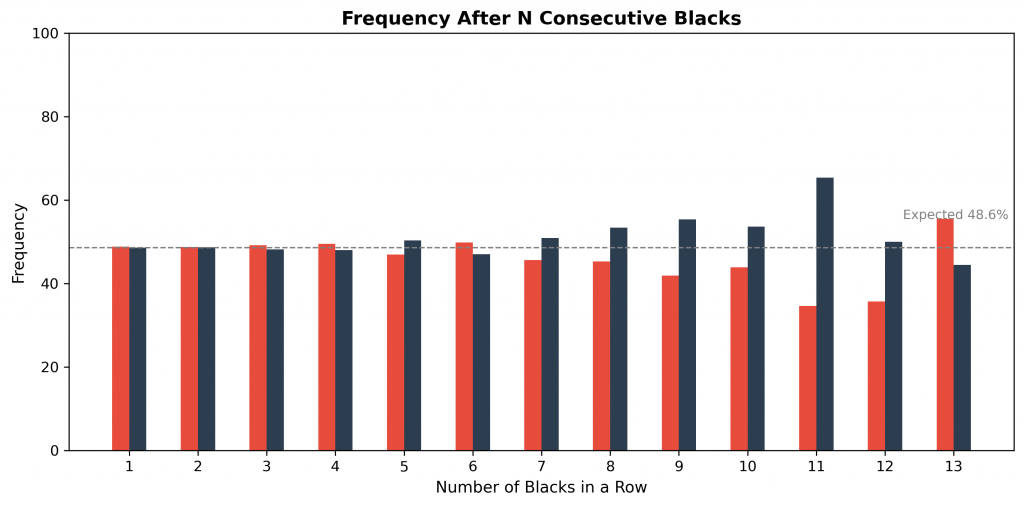
It may seem intuitive to expect red after many blacks, but the data shows no such effect. The wheel has no memory—each spin is independent, regardless of what came before.
Strategy Simulations:
With the fairness and randomness of outcomes established, the focus shifts to strategy—starting with the well-known Martingale system, where the bet doubles after each loss and resets after a win.
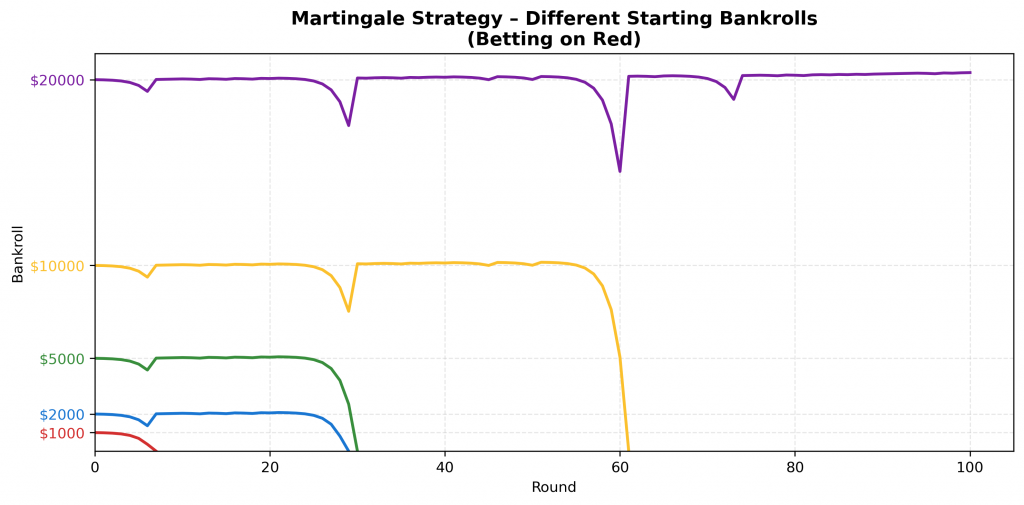
Since the strategy’s risk depends on how many times a player can double before going broke, the plot simulates different starting bankrolls to reflect this sensitivity.
As shown, Martingale can appear stable for a while, especially with larger bankrolls. But a single long losing streak can wipe everything out. The risk grows fast, and the fall is sudden.
Next is the Paroli strategy, often called the « reverse Martingale, » where bets double after each win instead of each loss and reset after 3 wins.
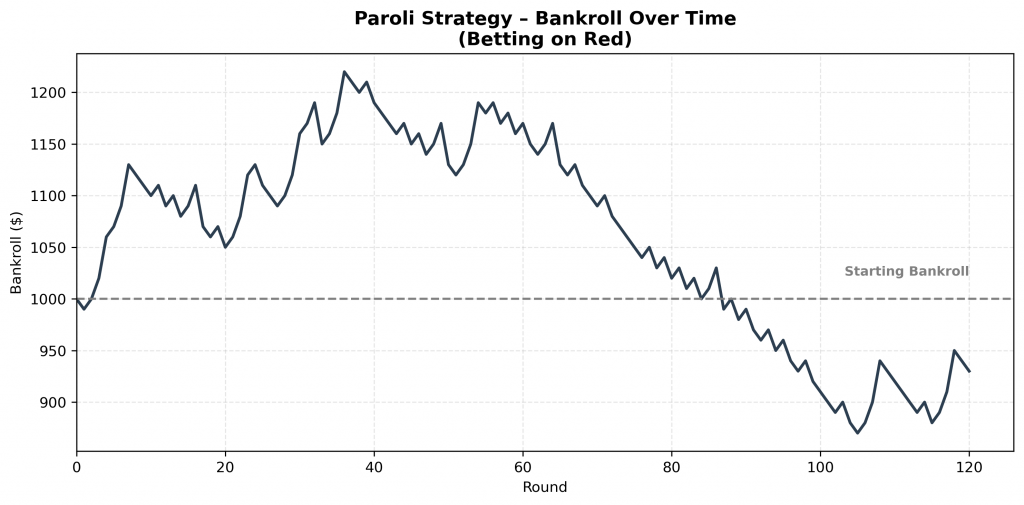
This approach limits downside risk, as the player is mainly reinvesting winnings rather than chasing losses.
The James Bond strategy splits each bet like this: 70% on numbers 19–36, 25% on 13–18, and 5% on 0—just in case.
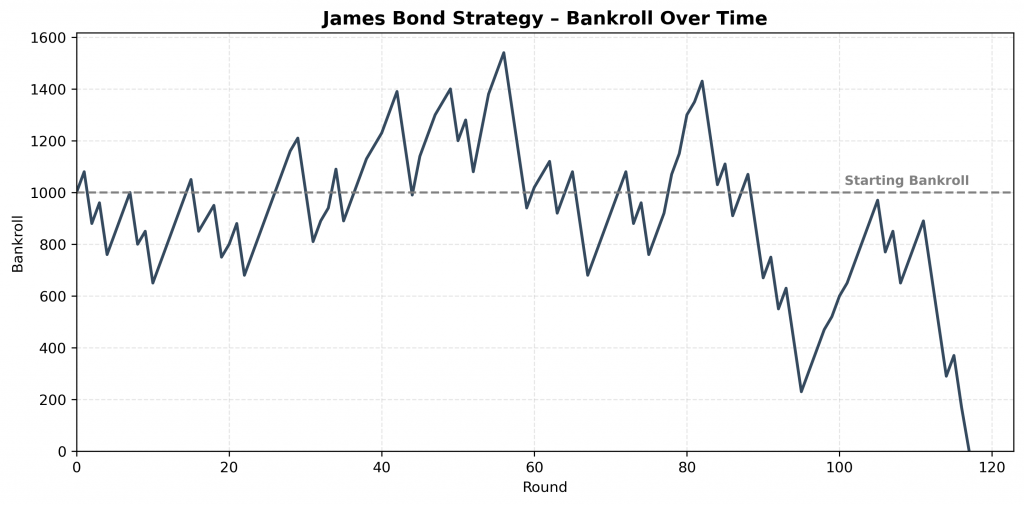
It feels clever, covering most of the wheel and creating the impression of safety with frequent small wins.
This comparison shows how the three strategies perform over another set of 120 rounds using the same starting bankroll ($1,000).
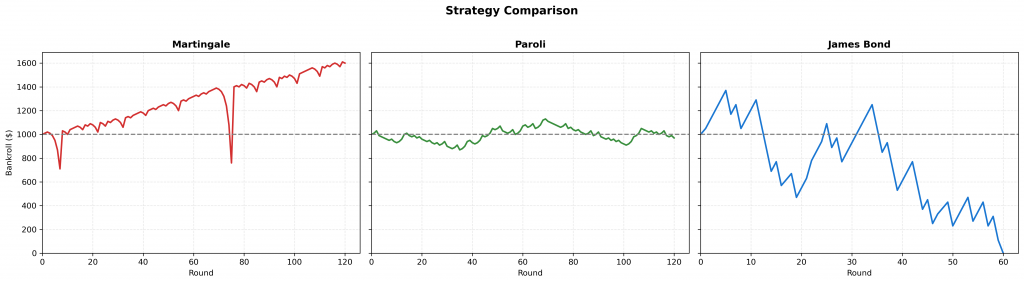
These individual examples show how the strategies can behave in specific runs, but no solid conclusion can be drawn from just a few simulations.
To get a clearer picture, 1,000 simulations of 100 rounds were run for each strategy, using a starting bankroll of $1,000, to estimate how often they end in failure.
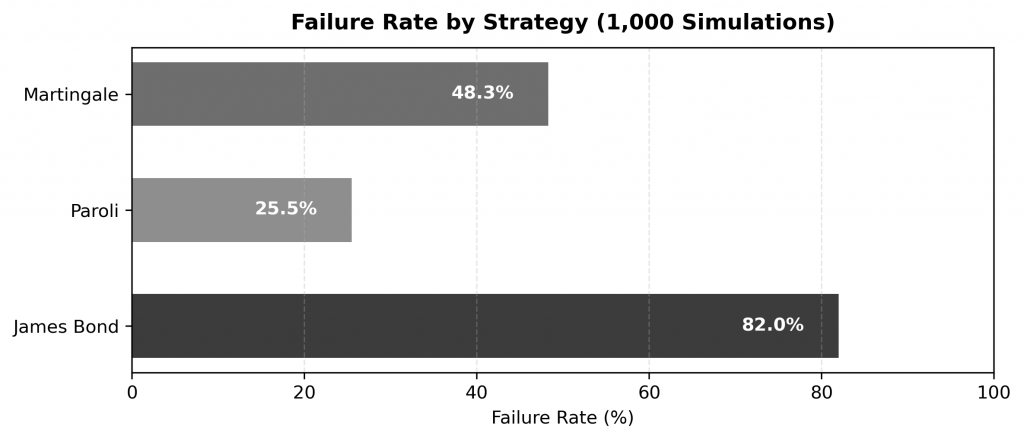
James Bond has the highest failure rate, while Paroli shows the most resilience. Martingale falls in between—less stable than it looks.
To measure how unpredictable each strategy is, the normalized standard deviation of final bankrolls across the 1,000 simulations is used as a proxy for uncertainty.
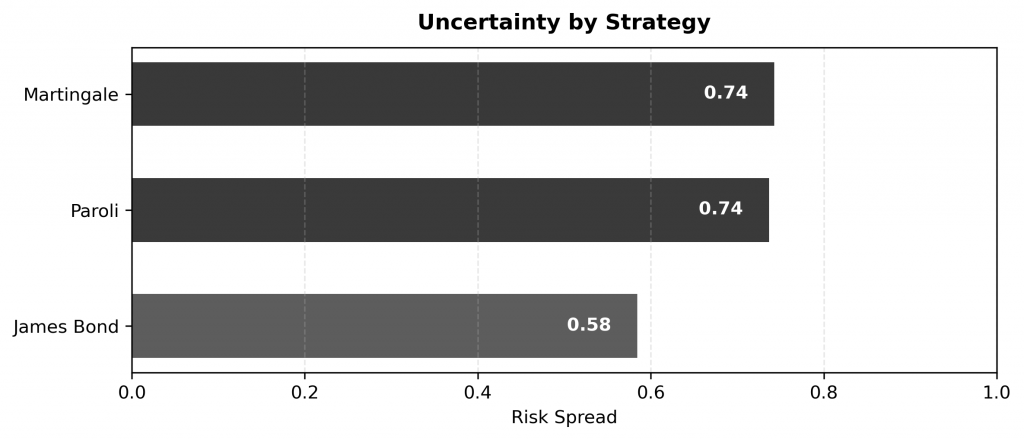
Martingale and Paroli show similar levels of volatility, while James Bond, despite its high failure rate, is actually more consistent—just not in a good way.
To estimate profit potential, the normalized average of the top 5% highest profits from the simulations is used.
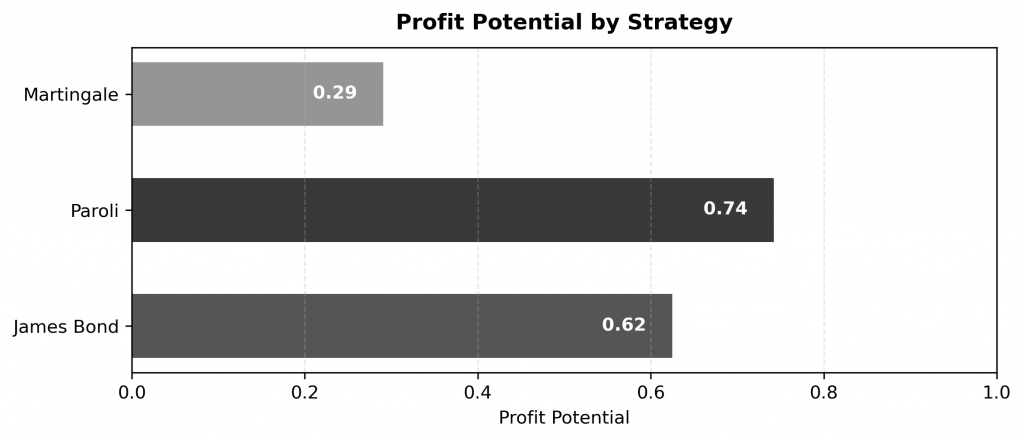
Paroli shows the greatest upside, followed by James Bond. Martingale ranks lowest, showing that its aggressive approach doesn’t translate into high long-term gains.
To summarize the results, the radar chart brings all three metrics into one view.
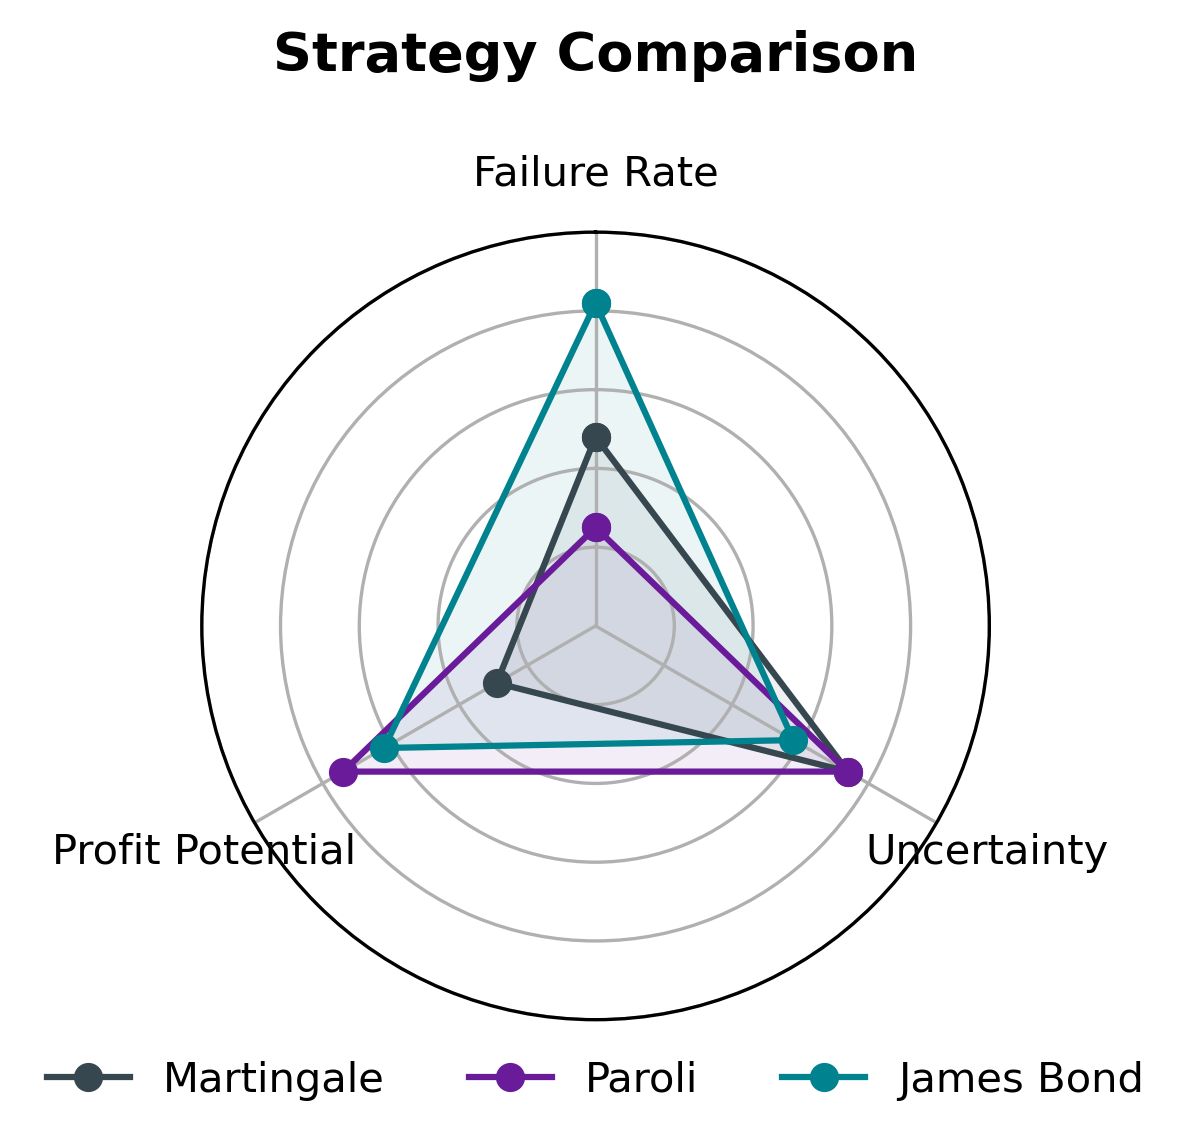
Paroli strikes the most balanced profile, with low failure, strong upside, and moderate risk. Martingale carries high risk with limited reward. James Bond stands out with high failure but decent profit potential, suggesting a strategy that occasionally hits big—but more often burns out.
Putting It All Together
Roulette remains a game of luck, and no strategy can overcome the house edge in the long run. While some systems offer better short-term performance or manage risk more effectively, all come with trade-offs. The data shows that understanding those trade-offs is more useful than chasing illusions of guaranteed success.
In the end, if you’re playing, make sure it’s for fun—not for profit.
