Every year, millions of tons of plastic waste find their way into the world’s oceans, threatening marine ecosystems. What once seemed like a revolutionary material for convenience has now become a global environmental crisis. From microplastics in the sea to massive floating garbage patches, plastic pollution is reshaping the natural world in alarming ways.
This issue is not just about discarded bottles and straws, it’s a complex problem fueled by mass production, inadequate waste management, and our modern dependence on single-use plastics.
Countries around the world face different levels of responsibility and risk, with some regions contributing disproportionately to marine pollution while others suffer its devastating effects.
Understanding the scale, sources, and consequences of plastic pollution is crucial for finding solutions. This article will explore the global impact of plastic pollution through data-driven visualizations, shedding light on the biggest contributors the fate of plastic waste, and the urgent need for sustainable action.
The scale of the problem
A hundred years ago, plastic was barely a part of our daily lives. Now, it’s everywhere from grocery bags to medical equipment. But the problem isn’t just that we use plastic, it’s that we throw most of it away. Since 1950, humans have produced more than 8 billion tons of plastic.
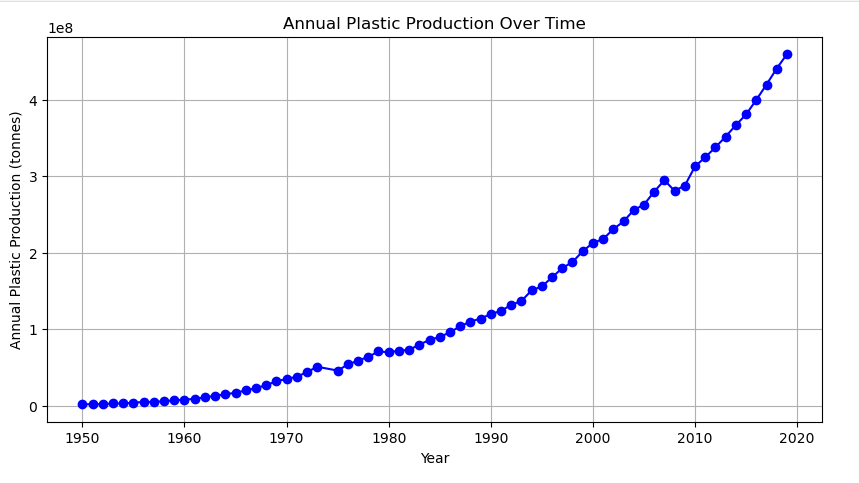
The graph above shows an exponential increase in plastic production from 1950 to 2020. In the early years (1950–1970), the production growth was relatively slow. After 1970, the plastic production increased, indicating rapid industrial expansion and higher plastic demand.
Who’s responsible?
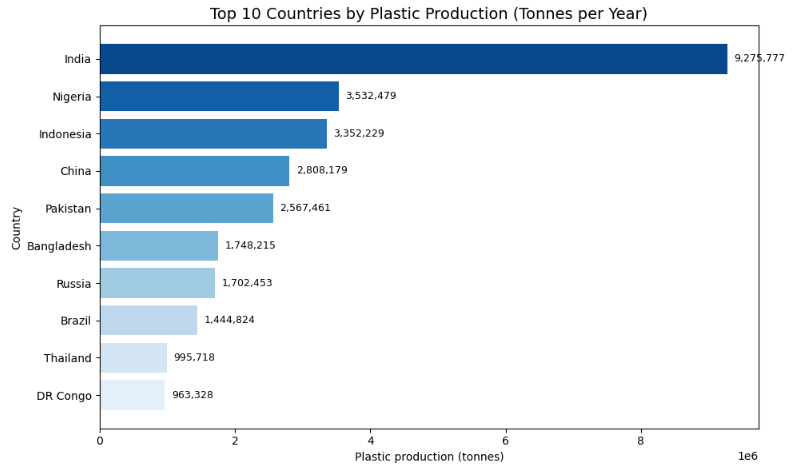
Not all countries contribute equally to the plastic crisis. Some generate much more waste per person than others. It’s important to distinguish between countries that produce the most plastic and those that generate the most plastic waste. China was the world’s largest producer of plastic, with a 32% share of global production. But, after overtaking China in 2023. India is now also responsible for the most plastic pollution accounting for around 20% of the world’s waste. However, the United States creates more annual plastic waste, highlighting a difference between production and consumption patterns. Therefore, a country may produce vast quantities of plastic but have effective waste management or export strategies, resulting in less waste generated domestically.
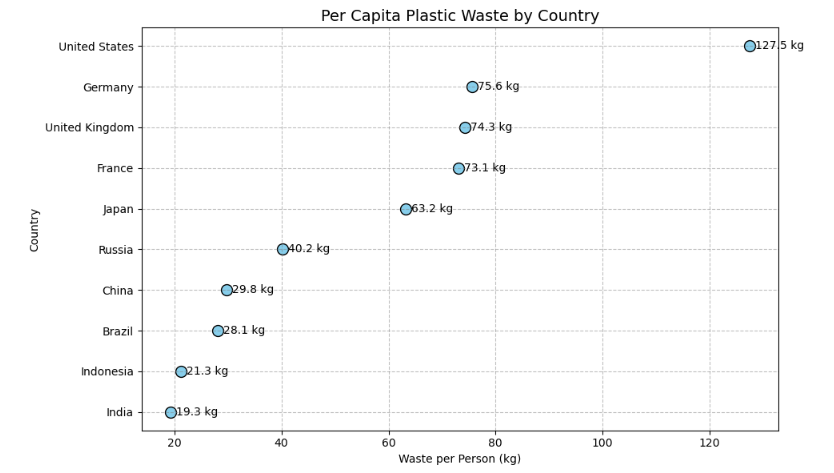
While various metrics can be used to assess plastic waste production, the United States stands out as the largest producer of plastic waste overall. This country generates an estimated 42 million metric tons annually. This figure is significantly higher than any other nation. However, it’s also important to examine per capita waste generation to get a comprehensive view of the problem:
Main sources of plastic waste
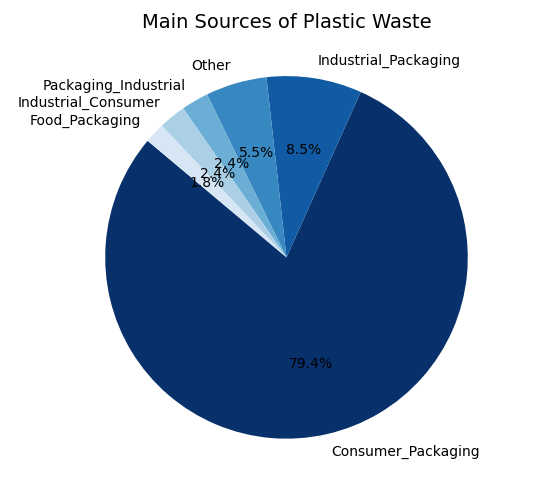
This pie chart shows that packaging is the largest source of plastic waste, generating 142 million metric tons annually. This category includes single use plastics like bags, bottles, and wrappers, which are commonly used in food and product packaging. The convenience and low cost of plastic packaging contribute to its widespread use. However, these benefits come at a significant environmental cost.
The Underwater Victims
Did you know that more than 100,000 marine mammals are killed by ocean plastic waste entanglement or ingestion each year? (UNESCO, 2022).
The oceans have the highest level of biodiversity on Earth, but pollution is causing a significant reduction in that biodiversity. The reality is, under the ocean is a world of silent suffering, where marine creatures are the victims of human plastic pollution. From a sea turtle mistakenly eating a jellyfish lookalike plastic bag, to seabirds and fish eating microplastics, the damage done by waste is extensive. Debris is also smothering coral reefs, which are home to marine biodiversity and important ecosystems, and by crowding out the sun, marine life is dying. This hidden crisis, in addition to being dangerous for marine life, also disrupts seafood chains and ecosystems, with consequences outside the oceans.
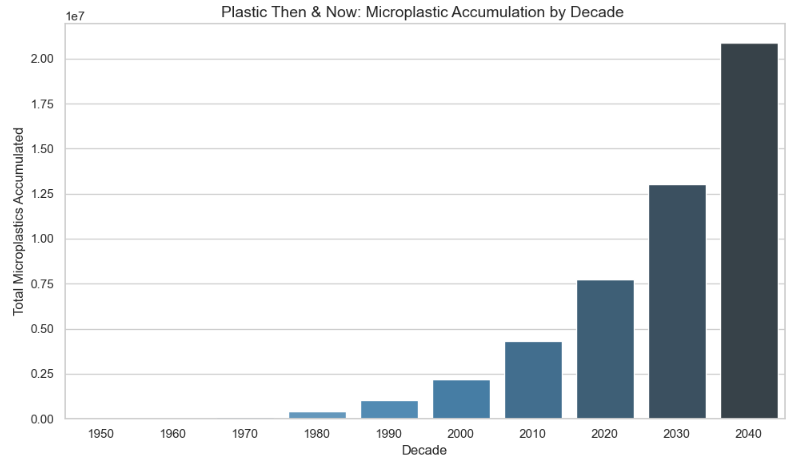
As the bar chart shows, the amount of microplastics accumulating in our oceans has surged dramatically over the decades. In the early years, the 1950s and 1960s, levels were nearly negligible, reflecting a time before mass plastic production. But, by the 1980s and especially the 1990s, microplastic accumulation began to rise steeply, mirroring the explosion of plastic packaging, fast food containers, and synthetic textiles.
What’s particularly alarming is the exponential growth seen from the 2000s onward. The 2010s alone account for a disproportionately large share of total microplastics in the ocean. Projections suggest that if current habits continue, the coming decades will surpass even these already troubling figures.
Plastic fate
Plastic does not decompose easily, it can take from 500 to 1000 years to break down, depending on the type of plastic and environmental conditions. So, it might be interesting to know what will happen to all the plastic produced. The vast majority is accumulating in landfills or sloughing off in the natural environment as litter. This means that at some point, much of it ends up in the oceans, the final sink. According to the Organization for Economic Co-operation and Development (OECD), only 9 percent of the plastic ever produced has been recycled.
Some countries find solutions in exporting their plastic waste to get rid of it. In fact, for decades, wealthier nations have exported contaminated or low-grade plastic waste to developing countries. For example, Germany is the world’s largest exporter of plastic waste, relying on other countries like the Netherlands, Poland, and Malaysia to manage this waste.
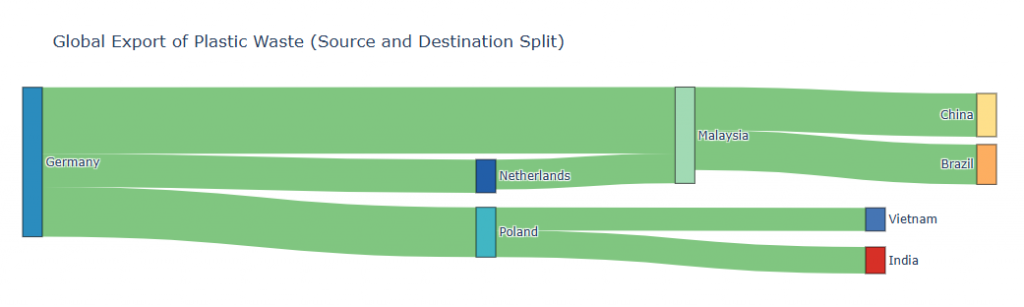
The Sankey diagram above visualizes how plastic waste travels across borders. Countries like Germany, Poland, and the Netherlands export large volumes of plastic waste to nations such as Malaysia, India, and Vietnam. In some cases, waste doesn’t stop at its first destination, it’s re-exported again, creating a complex global trail.
Taking action
As the world wakes up to the harsh reality of ocean plastic pollution, governments, organizations, and individuals are stepping up to make a difference. Many countries are implementing policies to reduce the pollution of plastic waste, such as banning plastic bag, increasing recycling laws and bans on single-use plastics. Some nations are pioneering innovative solutions, like the Philippines, where community-led clean-up initiatives are not only reducing plastic waste but also raising awareness about the issue. However, many other countries are implementing international agreements, such as the UN Global Plastic Pact encourages nations to take collective responsibility in order to reduce plastic pollution. The next move is to emphasize the need for the circular economy approach to prevent further damage to the ocean by recycling and reusing plastic in the future.
To conclude, although the steps are promising the road ahead is long. The widespread implementation of the initiatives is challenging. The accountability of industries, which contribute most to the plastic pollution, also needs to be ensured. However, the collective movement towards the plastic-free future is a crucial step to protect the health of the oceans and the creatures that depend on them.
References
What country produces the most plastic waste? – Geographic FAQ Hub: Answers to Your Global Questions
Map shows the 10 countries dumping and burning the most plastic | News World | Metro News
Global Plastic Waste Generation by Source (Updated List 2025) – Worldostats
Our World in Data: Plastic Pollution
Plastic Pollution
Global Plastic Waste 2023: Country-wise Data
