The volume of global food consumption has been ever-increasing since 2000. In 2014, the global consumption of food reached 2.5 billion metric tons. Small-scale farmers still feed about 70% of the world and three crops account for a third of the world’s food production: wheat, rice, and corn. Using Power BI and the data from FAO crop statistics and ourworldindata.com, this article shares some numbers related to daily consumed goods and the big contribution that small-scale farms bring to the world.


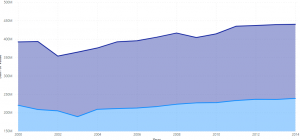
The value of cereals (wheat, rice, and corn) went up 180% between 2000 and 2014, from USD 12 billion to USD 34 billion (fig2), during this period, the export quantity increased by 88%. The value kept rising with a few fluctuations for cereals however for other crops the export value wasn’t as consistent. The percentage of each cereal’s value stayed the same throughout this time at 35% for wheat, 32% for rice, and 32% for maize (fig1)

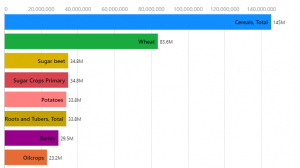
Fig3: Export Value of the Top 7 produce Item in the Russian Federation, Wheat (pink), Cereal (blue) – 2014
The largest producer of wheat is the Russian Federation at 228M$ in 2014, and some of its other produce includes potatoes and sugar crops (fig3), by 2014 the sum of its export value was 0.37B$. The leading producer of corn remains the United States at 21%, it produced 1B USD of raw cereals, some of its other crops include berries, seeds, pumpkins, and tomatoes. The main exporters of rice are India and China (fig4). India exported 200M USD of rice in all forms in 2014 and China takes second place, many other eastern Asian countries are not far behind.

Fig4: Export Value of Rice in India (Violet) Vs China
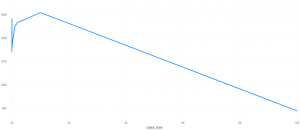
There has been a puzzle in development economics where smaller farms give a bigger yield* than farms on larger pieces of land. There are a lot of explanations for this, namely, smaller fields have more labor per square meter, lands that have a higher perimeter to area ratio have more edge plants that get more attention helping with disease control, local people tend to own these smaller farms and therefore are more familiar with the kind of pesticides suitable for their soil. In the graph below (fig5) An increase in the farm size decreases the yield of a farm, this proves that helping small scale farmers financially and educationally shows significant positive results.

Fig5: Crop Yield and farm size
Underdeveloped countries have in common the fact that smaller farms are dominant (fig6). At the heart of Africa’s agriculture are smallholder farmers, some 33 million hardworking individuals who typically farm on less than a hectare of land. Small-scale farmers usually produce drops for local consumption, but their commodities, such as maize, macadamia, and avocado, can find their way into the export market.

Fig6: Land Size proportions in different countries
Small farms are more environment friendly, produce higher yields, and support local economies, moreover, it is important that we do not put all of our theoretical eggs in one breadbasket as a reliable system is built on redundancy: small diverse farms scattered across the country makes the food industry much more resilient in the face of plant viruses and increasingly destructive weather.
*yield: A measurement of the amount of agricultural production harvested per unit of land area.
