Introduction
The purpose of this study is to answer some questions related to the one of the most exciting and in-demand field in the job market Data Science. We will be providing an overview of the Data Science salaries, remote ratio, experience level, and employment type from 2020 till 2022. We will be studying the different criteria that influence salary based on public dataset from Kaggle https://www.kaggle.com/datasets/ruchi798/data-science-job-salaries.
To narrow our subject matter, we will focus on the many criteria landscapes all over the word. We will be using Microsoft Power BI to visualize our data in this study.
First, Data science is an interdisciplinary field that uses scientific methods, knowledge of mathematics and statistics, programming skills, processes, algorithms, and systems to extract or extrapolate knowledge and insights from noisy, structured and unstructured data, and apply knowledge from data across a broad range of application domains.
As we know, Data Science careers are one of the most highly compensated careers worldwide currently. Due to its broad application in every industry, there is a higher demand for data scientists who can analyze complex data and communicate the results effectively.
In 1962, John Tukey described a field he called « data analysis », which resembles modern data science. The term « data science » has been traced back to 1974, when Peter Naur proposed it as an alternative name for computer science. In 1996, the International Federation of Classification Societies became the first conference to specifically feature data science as a topic.
These aren’t the only domains where data science may be used. Apart from these uses, data science is used in marketing, finance, and human resources, healthcare, government programs, and any other industry that generates data.
A Sampling of Data Science-Related Jobs
Based on our data these are some career opportunities that relate to data science:
Data Scientist, Machine Learning Scientist, Big Data Engineer, Product Data Analyst, Machine Learning Engineer, Data Analyst, Lead Data Scientist, Business Data Analyst, Lead Data Engineer, Lead Data Analyst, Data Engineer, Data Science Consultant, BI Data Analyst, Director of Data Science, Research Scientist, Machine Learning Manager, Data Engineering Manager, Machine Learning Infrastructure Engineer, ML Engineer, AI Scientist, Computer Vision Engineer, Principal Data Scientist, Data Science Manager, Head of Data, 3D Computer Vision Researcher, Data Analytics Engineer, Applied Data Scientist, Marketing Data Analyst, Cloud Data Engineer, Financial Data Analyst, Computer Vision Software Engineer, Director of Data Engineering, Data Science Engineer, Principal Data Engineer, Machine Learning Developer, Applied Machine Learning Scientist, Data Analytics Manager, Head of Data Science, Data Specialist, Data Architect, Finance Data Analyst, Principal Data Analyst, Big Data Architect, Staff Data Scientist, Analytics Engineer, ETL Developer, Head of Machine Learning, NLP Engineer, Lead Machine Learning Engineer, Data Analytics Lead.
Skills Required for a Data Scientist
Algorithms, statistics, mathematics, Deep learning and machine learning knowledge are all important.
R, Python, SQL, SAS, and Hive are examples of programming languages that are required to be known by a Data Scientist.
Big data, Model development and deployment, Software engineering, Data visualization, Data analytics, Data analysis and manipulation.
Communication skills are required in order to properly communicate the results to the rest of the team.
Key Industries for Data Science Careers
Here are the main industries that offer the most data science job:
BFSI (this stands for Banking, Financial Services, and Insurance), Media and Entertainment, Healthcare, Retail, Telecommunications, Automotive, Digital Marketing, Professional Services, Cybersecurity, Mining, Quarrying, and Oil and Gas Extraction.
How to determine company size
Size is one of the most relevant ways in which businesses differ from one another. A company’s size is another relevant factor influencing data science salaries: in general, the larger the organization, the larger the salary.
Several indicators to determine company size, including:
Number of employees – how many people are recruited by the company. Big businesses employ more workforce than small businesses because they operate on a large scale.
Revenue – how much money is made from selling goods or providing services. An alternative is to use a sales volume measure.
Production – how much volume of output is produced. This indicator is irrelevant for service businesses because their output cannot be quantified as for manufacturing companies.
Amount of invested capital – how much capital is owned by the company. It is usually positively correlated with the resources at hand. For example, capital can refer to the sum of equity capital and debt capital. Alternatively, we can refer to physical capital such as property, plant, and equipment.
Market capitalization – how much is the total value of the shares issued by the company. It only applies to public companies, where the shares are traded by the public and listed on the stock exchange.
Market capitalization = Company’s share price x Number of shares outstanding
Classifying business size
The four common categories of businesses based on their size are:
Micro-sized business: less than 10 employees
Small-sized business: 10-49 employees
Medium-sized business: 50-249 employees
Large-sized business: more than 250 employees
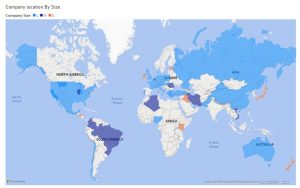
According to the map we can find companies in different sizes in the same continent.
We can check the continent of America that contain business of large size in north of America, Mexico and Chile, and we can find the business with medium size in Brazil, and north of America, finally we find small business in Honduras country located in the Central of America, and in Maryland located in the north of America.
Same for the remaining continents, we can find different sizes of businesses in different countries in the same continent.
Is the employees work in same location of business?
Employers may find that long term remote work is an option for their employees and business even after the pandemic. This is because of its positive impact on employee productivity, reduced real estate costs and a positive impact on the environment. Many businesses may not continue their remote work policy after the pandemic ends, while quite a few may continue having flexible work options for their employees. Flexible work policies will give rise to a growing need for co-working or shared workspaces and hot desking office models. The largest-ever global work from home experiment has helped remote teams learn new ways to communicate, set up varied productivity routines, and quickly adopt remote collaboration tools and technologies at work. Implementing remote work is not a one-time endeavor. Building up a functional remote work infrastructure across your company is a more significant undertaking than most companies realize. An understanding and robust corporate culture, coupled with a structured work from home approach, is essential.
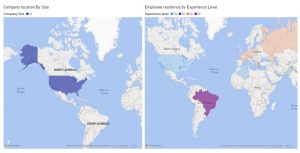
According to these maps, we can see that residence of employees differ from the location of business.
In 2022, we can see that senior employees in Brazil working in many businesses with size medium in north America.
In 2022, We can find same thing with mid senior employees in Russia, working in many businesses with size small in north America.
In 2021, we find mid senior employees located in Hungary, Italy and Romania, working in large businesses in America.
In other hand, we notice that employees in Algeria, Australia, Pakistan, Ireland work in the same location of businesses.
This issue can be asking a new question
Remotely is a new trend?
Fast Company predicts that remote work software, like mobile work tools and virtual reality conferencing, will become the preferred form of communication – even over face-to-face meetings.
AI will also likely play a major role in managing remote staff. These advancements might put companies more at ease. The transition to managing a remote workforce might be daunting, but with the right tech and hardworking employees, it can be a seamless process.
Furthermore, according to Global Workplace Analytics, 37% of remote employees would take a 10% pay cut to continue working from home. Because of this increasingly popular trend, some refuse to accept an onsite position, knowing they can find a more convenient and flexible gig elsewhere.
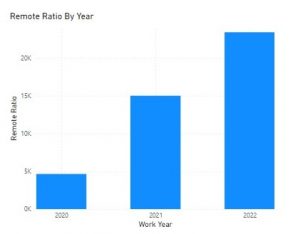
According to the chart, we can see the evolution related to number of working remotely hours over the years.
What are the types of Employees?
Based on the hours worked, job duties, and the expected duration of the job, most employers will classify their employees into five types, plus one extra type:
Full-time employees: Full-time employees usually work an average of 40 hours per week, are eligible for benefits, and may not have a set end date for their contracts. They are the so-called permanent employees. Also, if the business or organization has 50+ full-time employees in the US, it must offer health care coverage (health insurance) to these employees and their dependents. Full-time employment is often considered one of the most reliable and safe work conditions because employers offer a fixed salary plus overtime pay (calculated by the hour). However, in a job that only offers minimum wage, full-time employment can be a disadvantage, making it difficult for businesses to retain talent.
Part-time employee: These individuals work less than 40 hours per week and are usually paid on an hourly basis. Yet, some part-time employees prefer a salary basis, so it depends on the company. Plus, part-time employees can also be permanent if the contract doesn’t have a set end date. Yet, these individuals may not be eligible for benefits.
Temporary employees: Unlike permanent employees, temporary employees (or temps, if you will) have a set end date on their contract. These individuals often work within a company for somewhere between six months to one or two years. Also, some people are hired for the duration of a project. Then, their contract ends when the project is complete. Now, depending on the number of hours per week, you can have temporary full-time employees and temporary part-time employees. Overall, temporary workers are ideal for short-term projects and can help boost productivity during busy times. Also, hiring temps is a great way to probe the workforce and test people’s skills without having to offer a permanent position. This helps employees understand their eligibility for benefits. They can also have a fair assessment of their wages in accordance with the number of hours per day.
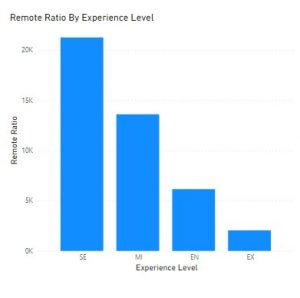
According to the chart, we can see that employee with senior level work remotely more than executive and mid-level senior and junior employees.
The type of employment for the role:
PT: Part-time
FT: Full-time
CT: Contract
FL: Freelance
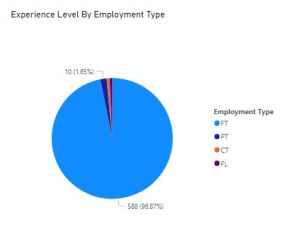
According to the pie chart, we find that All employees work 97% full time, 2% work part time,1% work with contract, 1% work as freelance.
Salary?
Salary expectations are always a key factor when looking for new job opportunities and, if you are considering breaking into data science, here is the great news: data scientists, as well as other data-related jobs, command some of the highest salaries in the tech industry.
According to the 2020 LinkedIn U.S. Emerging Jobs Report, data science has experienced continued growth on a tremendous scale in recent years. Across nearly every industry, organizations are competing for data science professionals to leverage their data and drive smart business decisions.
However, since the supply of data professionals has not yet caught up with the demand, the competition between companies in hiring these professionals is fierce compared to in other tech sectors. As a result, employers are willing to pay top salaries to talented data scientists.
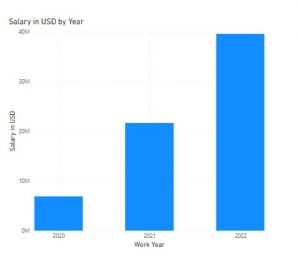
According to the chart, we can see that evolution of salary for data scientist through the past three years.
In 2022, salary rises to 40 million $ comparing with year 2021(23 million $) and year 2020(8 million $).
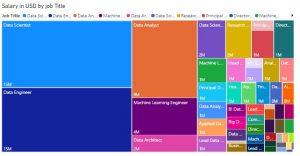
According to this treemap, we can see the relation between salary and job title, so we conclude that salary range of employees that working as Data scientist or Data Engineer is above 10 million dollars for the past three years.
Employees how working as Data Analysist her Salaries range is above 5 million dollars but below 10 million dollars for the past three years.
All remaining employees her Salaries range is below 5 million dollars for the past three years.
In 2020, salary of data scientist employees is 2 million dollars Compared to 2022 this salary growth to become 10 million dollars.
Future
Data Science careers are one of the most highly compensated careers worldwide currently. Due to its broad application in every industry, there is a higher demand for data scientists who can analyze complex data and communicate the results effectively.
The future of Data Science jobs will look like the middleman who can communicate with computers and humans.
AI and Machine learning are just tools that a data scientist uses to deal with big data. Data Science and Machine learning go hand in hand.
The future of data science is believed to witness some of the biggest innovations seen in the last decade, starting from the data explosion to the growth of the internet of things (IOT) and social media.
Experts predict that in the next decade, the rise of machines with lead to the growth in usage and utility of computer systems and mobile devices. Experts also claim that social media use will substantially increase with users consuming numerous amounts of data online. Machine learning algorithms will also see a steep rise estimates some experts.
Conclusion
Data science has proven to be a powerful tool to extract meaningful insights from this large chunk of data. These insights help organizations in determining any prominent changes that are to be made basis the changing consumer behavior, shortcomings of previous solutions, forthcoming challenges and competition analysis.
The position of the data scientist is now a buzzworthy career. It has staying power in the market and gives possibilities for folks that observe statistics technological know-how to make valuable contributions to their businesses and societies at large.
Data Science has critical applications across most industries. Organizations, big and small, need Data Science to make decisions, analyze market trends, minimize losses and maximize profits.
Data has become the backbone of business decision making: Organizations generate a huge amount of data regularly.
According to estimates, the total amount of data created, copied, captured and consumed in the world is likely to reach 149 zettabytes by 2024, as compared to two zettabytes generated in the year 2010.
The biggest organizations in the entire world are statistics technology-fueled enterprises, Google, Amazon, and Facebook. Each use statistics technology to create algorithms that enhance consumer satisfaction and maximize profits.
References
https://www.aihr.com/blog/employee-classification/
https://www.businessnewsdaily.com/8156-future-of-remote-work.html
