Happy countries and their factors.
The happiness of a person says a lot about them, what about a whole country?
The United Nations Sustainable Development Solutions Network created The World Happiness report since 2012 to study the progress of 156 countries and rank them due to their happiness score. They collect data from the Gallup world poll, the scores are based on answers to the main life evaluation question asked and they are rated from 0 to 10, 10 being the highest score.
In this project, I used the data given from the years between 2015 and 2019. I drew some graphs using google charts, and analyzed them. The results show the regions that are considered happier than others, and the main factors that affect a country’s happiness.
Which countries are considered happy?

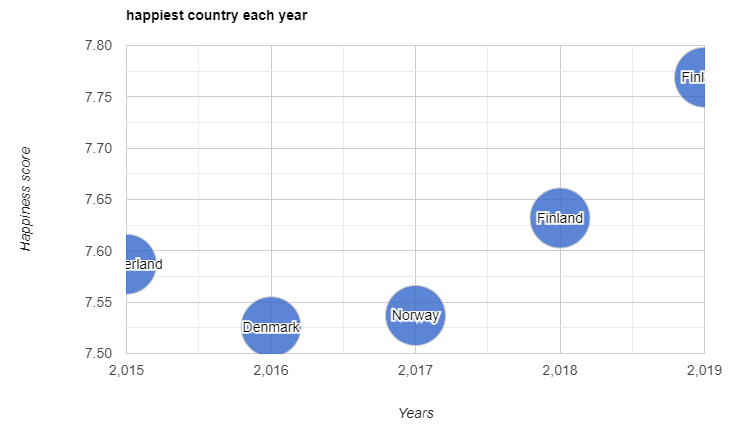
This bubble chart (fig. 1) shows the countries that were ranked as the happiest each year from 2015 till 2019 with their happiness score. Listed respectively: Switzerland, Denmark, Norway and Finland twice in a row: all these countries are European and their score is greater than 7.5.

Fig.2 is a colored map showing the degree of happiness score all over the world in 2019. The greener the country, the happier it is. It is clear that the most satisfied regions are North America, Europe and Australia. The Arab countries that are standing out with a happiness score higher than the rest are Saudi Arabia, UAE and Kuwait.

These three countries shown in fig.3 are considered from the happiest during this timeline.
So this line chart showcases the variation of their happiness score over the years and how they compete. The satisfaction of the Swiss has decreased a little, in Denmark the score has improved on a small-scale. However, Finland has made a huge variation, especially between 2017 and 2018 getting to the top, and kept progressing maintaining its first spot with the highest score reached these five years of 7.769.
What makes a country happy?

Fig.4 represents the variables taken into consideration to calculate the overall happiness score.
GDP (Gross Domestic Product): to measure the economic state of each country.
Family: to show the importance of social relationships on happiness, and how people having those who love and listen to them influences their lives.
Life expectancy: it represents health and its importance on a happy life.
Freedom: as in freedom to make life choices and be independent. To have all needed human rights.
Government trust: it has an impact on the happiness score whether by being effective or corrupted.
As the happiness is the sum of these factors scores, then the variable with the highest score has the biggest effect on the country’s happiness. Thus, this column chart shows the importance of economy (GDP) on the country’s progress.

This scatter plot (fig.5) represents the relation between the economy of a country and the life expectancy of its citizens; there is a positive linear relation between these two variables. So if the economy is good, the resources to a healthier life are found: thus the life expectancy is longer.
Lebanon

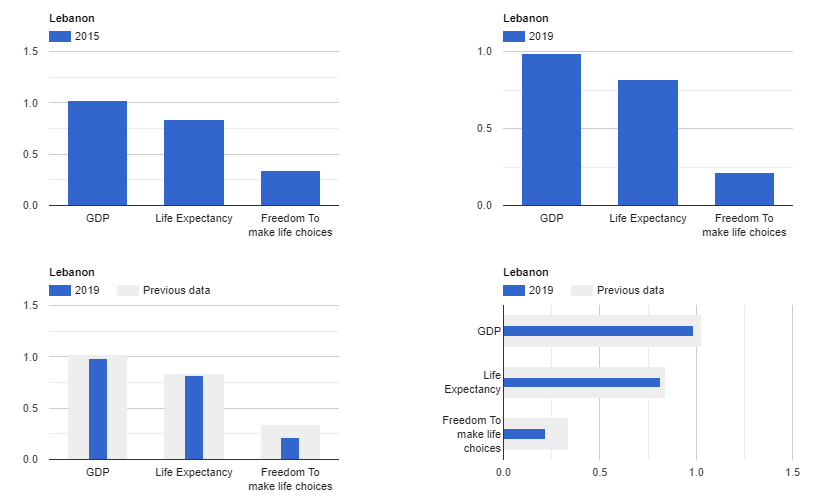
Fig.6 shows the difference in scores of GDP, life expectancy and Freedom between 2015 and 2019 in Lebanon. In the bottom bar charts, the white bars are those of 2015 and the blue one for the 2019 scores. Unfortunately, Lebanon has remarked a decrease in the scores of these three variables over the years.
Conclusion
A country is considered happy when the citizens are happy. A satisfied life is a comfortable life where people can afford to get everything they need, have a family and loved ones, are healthy, have the freedom to make the choices they like and have trust in their government.
True happiness is a state of mind found within us. With everything said, what about you? Are you going to move to a happy country or try and make your own country happier?
