The rapid growth of internet usage has opened the way for the evolution of new interconnected systems, devices with internet connections. The covid-19 pandemic also increased internet usage. With the lock-down, the normal state is working from home. Which led to the creation of new Cyber-attacks and Cybercrimes and the essential scope that the hacker desires. Nowadays, hackers can access some networks from a TV unit, baby monitors, refrigerators, light bulbs, smart meters, and any daily used devices. Those devices are either targeted for their values or can perform as a bot army to attack more significant and essential networks.
The complexity of new cyber-attacks needs meaningful change in the way of defense, the traditional approach and being defensive is no more a solution for securing cyberspace. We need more aggressive strategies, such as early warning systems, one of these new ways is Honeypots. This system is a deceived system that simulates vulnerable systems or services and attracts hackers to use their techniques to understand their behavior. Hackers can identify the honeypot, resulting in the evolution of new interactive honeypots that can fool hackers. Basic honeypots like the one used in our studies can be a satisfactory solution for understanding automated attacks or catching hackers in the first phase, which is scanning.
This study will discuss and visualize the result of 8 honeypots from hornet [1] geographically separated: Amsterdam, London, Frankfurt, San Francisco, New York, Singapore, Toronto, and Bengaluru. The distribution of those honeypots, as they mentioned, is used for understanding the geographical impact of the attack’s flow. Traffic coming to those servers achieved by netflowV5 collected this dataset for 40 days captured in April and May 2021. Although we can make various interpretations from this data. We choose four important questions to answer with visualizations:
- How are attacks spread?
- Where do most attacks originate by IP (Internet Protocol) addresses and countries?
- Which services and Protocol are the most exploited or scanned?
- Username and Password used by hackers?
- Number of attacks received by each sensor
The reason behind the geographical distribution of honeypots sensors is getting the distribution of attacks concerning various locations. For that, we will start by visualizing the distribution of the attacks on each server by time (Figure 1). We can see that most of the time flows collected by the different servers are near each other, except London and Frankfurt in the first week and the latest one.
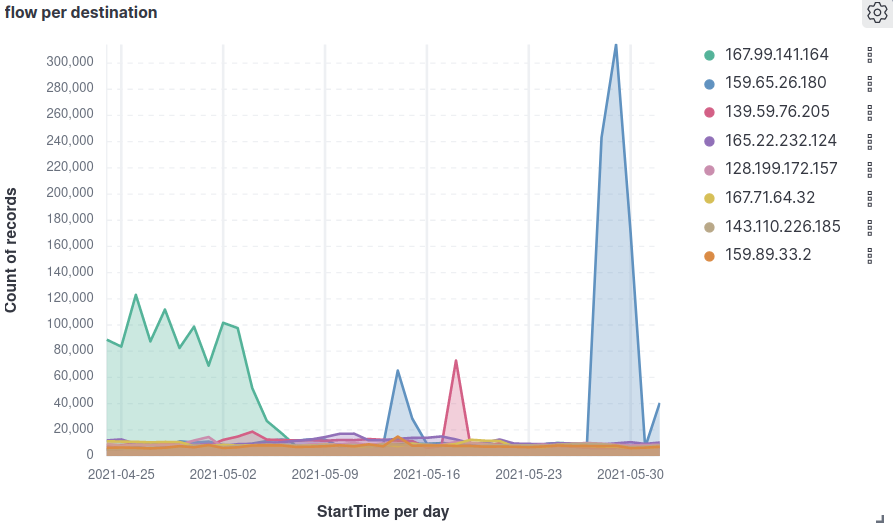
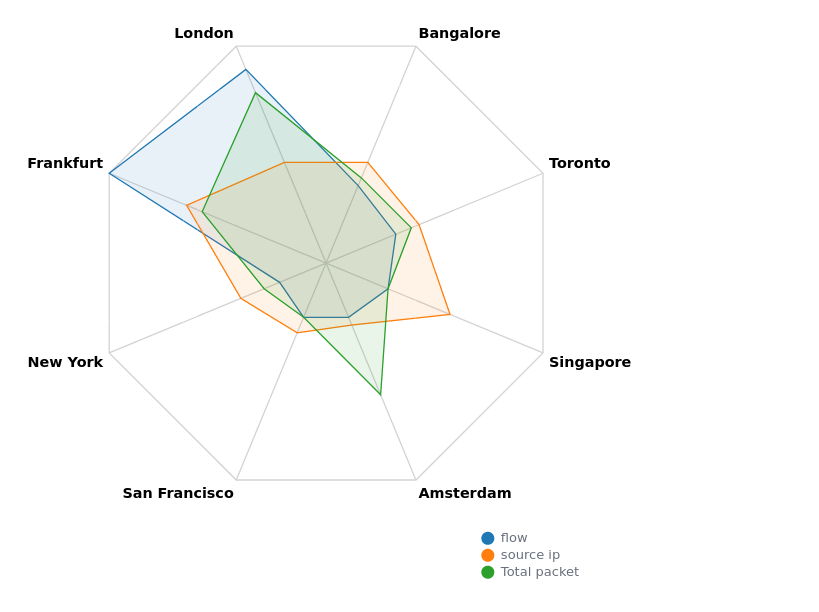
The first graph shows that some servers are more targeted. It is more apparent that flows targeting London and Frankfort are more extra. We need to consider this result for later honeypot implementations to confirm that some countries are more targeted. To assure this hypothesis, we choose to visualize the sum of flow received by each server during the 40 days. We use the radar graph (figure 2)and add total bytes to each server’s flows, showing London the most targeted. On the other hand, we choose unique source IP, which does not significantly vary between servers.
- Source of Attacks.
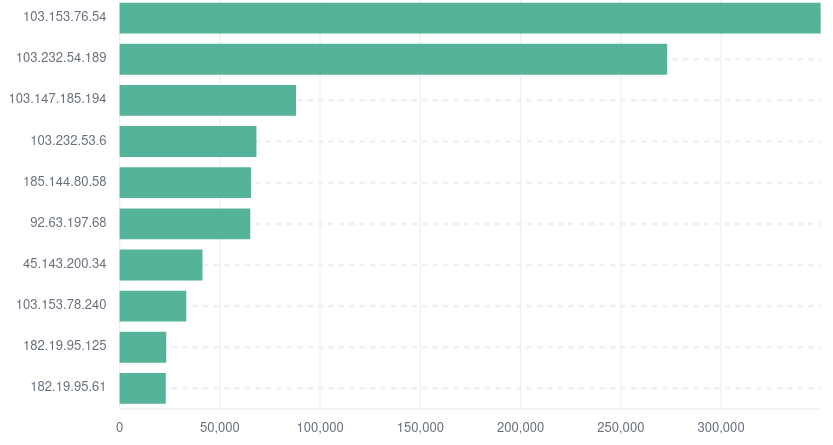
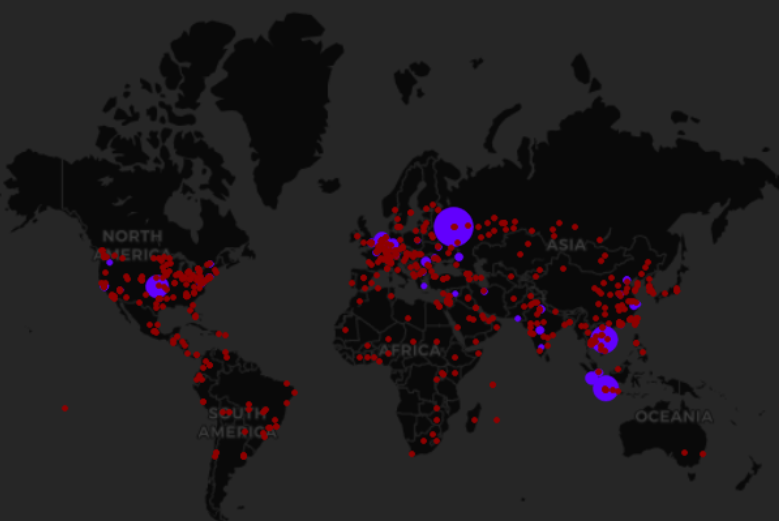
After checking the destination part and knowing the distribution of attacks across servers, we need to start inspecting the sources of attacks. The first indicator is the source IP address from which we can identify abused IP used. For that, we visualize the top used source IP by flow count in the below figure. These sources are primarily hackers’ IPs, and if we check a website like https://www.abuseipdb.com, we can see that those IPs are reported as a scanner or other abusive activities.
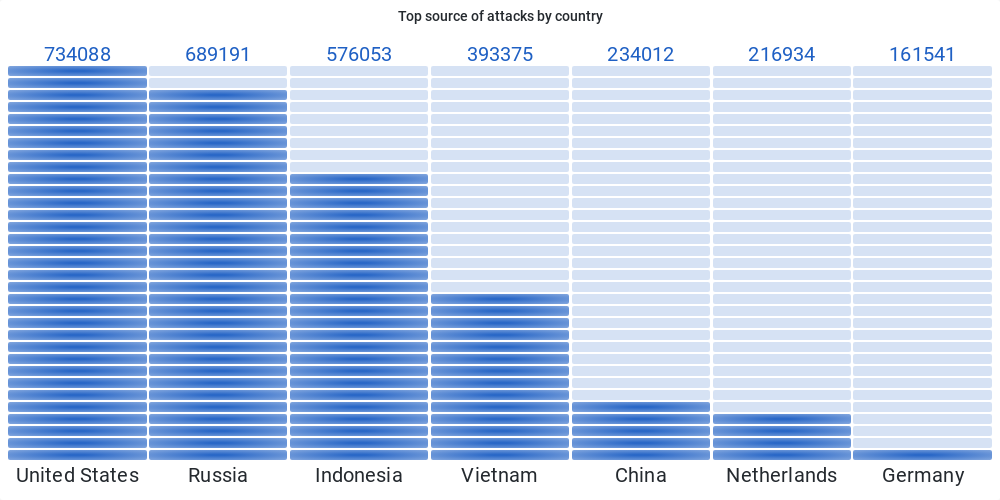
For more information, we use Logstash GEOIP plugins [2] to transform the IP to location. We visualize TOP country by flow’s source count. We follow this figure with a map that shows all origin of flows, and we can clearly conclude that attacks originate from all countries of the world.
- Protocol and services
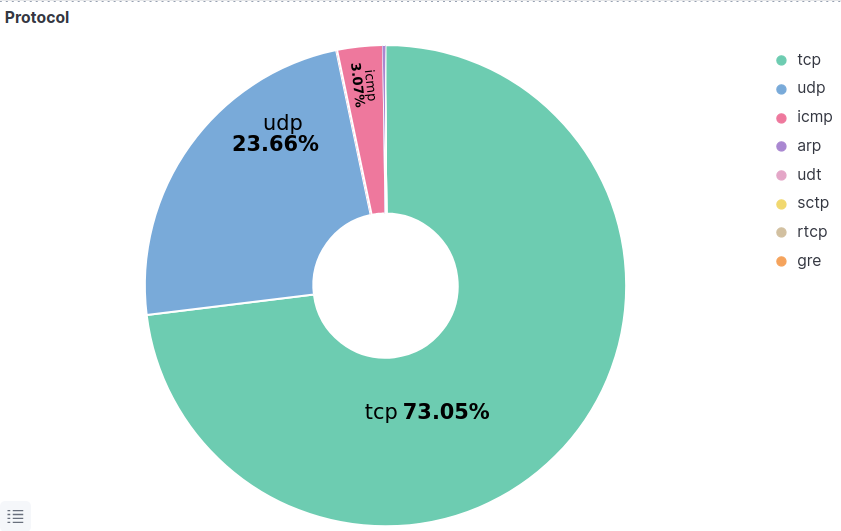
Going further into our investigation, we walk through protocol and service in this way. We can answer the question of which service is more exploited. We start visualizing the protocol used(figure 6), and it’s clear that TCP, UDP, and ICMP are the most protocol used. SCTP, RTCP, ARP, and GRE protocol are excluded from our study because we can see from the figure below that they construct about 0.2% of the data like one packet each, ARP is a layer two protocol and does not have significant value for this study. For the same concerns, we will dive deeply into the UDP and TCP protocols to clearly understand what services in each protocol are the most exploited. We will introduce this in the later graphs.
- 1 TCP services
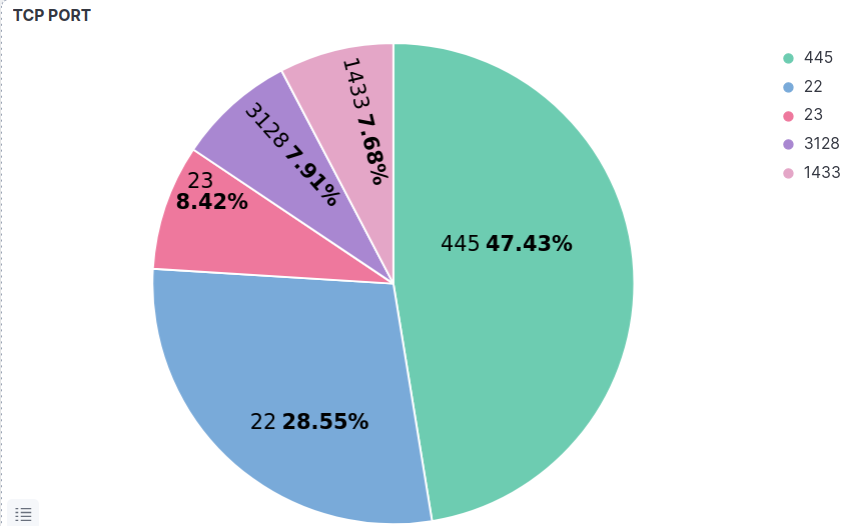
Protocols are the network connection identifier, and each protocol as UDP and TCP, gives an idea of how network devices handle data transmission. Connectionless or connection-oriented, each network service needs to have a port to communicate through. Port can be private and public, and within the range, 1-65535, well-known services HTTP, HTTPS, telnet, and others have default port assigned to them. Still, network security teams may change port values to the private range in multiple cases for security reasons. This graph shows the TCP port used most, and we can see the 445, which is the port assigned for the SMB (windows sharing) first and then 22 (default ssh port) and 23 (default telnet port).
3.2 UDP services
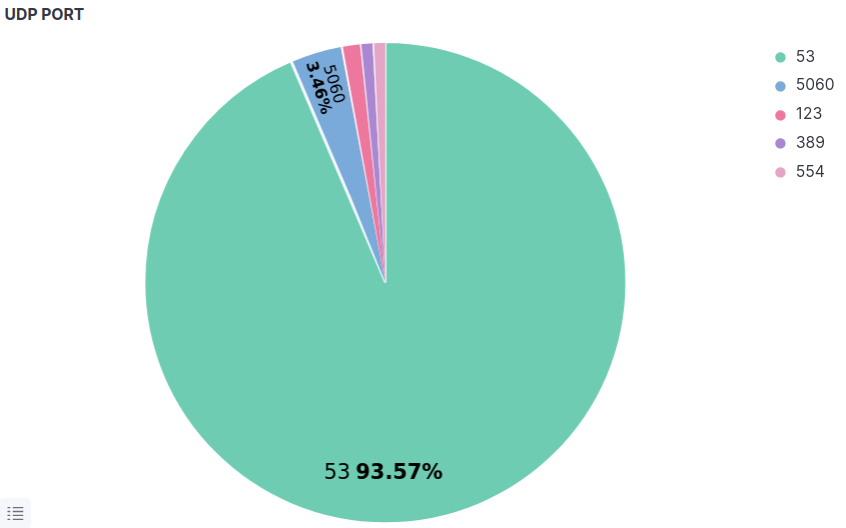
UDP is connection-less protocol and see below also the top port used, and we can see that DNS (53), and after that SIP protocols (5060) are the most exploited and this an indication for the security team to understand the risk and try to go through these two services to see if any vulnerability reported and try to secure it.
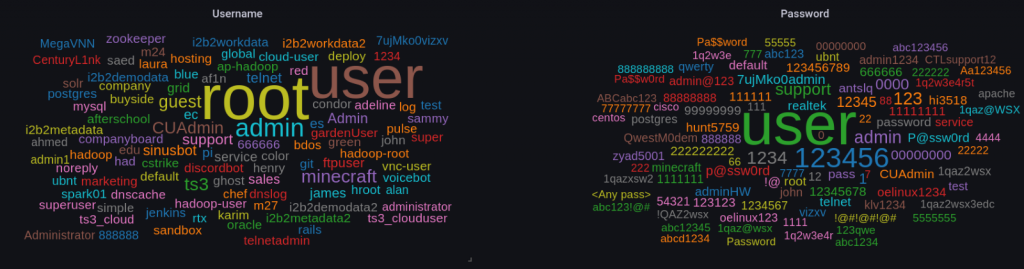
- Top Username password used by hackers
We used the NetFlow version of the hornet dataset, which does not contain usernames and passwords used by hackers. For that purpose, knowing that this factor is essential for users to know which password and username need to exclude from their choice, we used another dataset from Cyberlab [3], which uses cowrie honeypot that simulates SSH Telnet and HTTP services. We can notice that default users and passwords are primarily used, and on the other hand, a password like (« 123456 », « password123 »). In conclusion, we need to avoid using usernames and passwords combination.
- Conclusion
Finally, in this study, we answer our question, future analysis, and more work, especially with the NetFlow extended version. We may go deep like flags and the payloads (PCAP traffic). This study can serve as an introduction to how to visualize honeypot results and extract values from them to secure your network. Consider patching (updating) your services, closing unused services. Block hackers IP reported, or at least mentioned for further inspection, prohibit the use of default username and password, and what we tell in our study or other honeypot results.
REFERNCES
[1] Valeros, Veronica (2021), “Hornet 40: Network Dataset of Geographically Placed Honeypots”, Mendeley Data, V3, doi: 10.17632/tcfzkbpw46.3.
[2] [online] Available at: <https://www.elastic.co/guide/en/logstash/current/plugins-filters-geoip.html> [Accessed 4 October 2021].
[3] Sedlar, Urban, Kren, Matej, Štefanič Južnič, Leon, & Volk, Mojca. (2020). CyberLab honeynet dataset (1.0) [Data set]. Zenodo. https://doi.org/10.5281/zenodo.3687527
