In general, the economy of countries is affected by several factors like the income group, GDP per capita…
When you own your own business, you need to understand much more than just how it functions on its own. This is because so many factors go into owning and running a successful business. The main reason for running a good business is the strong economy of the country you want to run your business in.
In this blog we will present the economy variation between countries in 2015 according to many factors in purpose to analyze the effect of these factors on the economy of countries, to know where to invest and under what condition, by using Power BI and Tableau Public.
Affection of economy by factors:
1- In the clustered bar chart, we can see that Luxemburg has the greatest GDP then Switzerland and finally Central African Republic and Burundi has the lowest GDP between countries.

2- In the Area Chart we can see that Europe has the greatest GDP and South America has the lowest GDP between Continents.

3- In the line and stacked column chart we would see the average of gross savings and inflation rate by income group, we can say that the Country with high income has greater gross savings and lower inflation rate then other income groups however the low-income country has lower gross savings and greater inflation rate then other income groups, we can say that the gross savings and inflation rate have decreasing relation.

4- In the Funnel we can see that Africa has the greatest number of investments this is due to the primary resources that are abundant in it, in the other hand Oceania has the lowest number of investments this is due to the scarcity of primary resources in it.

5- In the line chart we could see the variation of imports and exports in each country and which countries has imports more than exports (for example Mali) and which countries has exports more than imports (for example Ireland).

6- The line and clustered column chart describe the relation between the average of inflation rate and several gov forms, we can see that the (Islamic republic’s forms have the greatest inflation rate (average) Iran for example, however federation form has lowest inflation rate Switzerland for example).

7- This is the scatter chart showing that we have strong linear relation between imports and exports.

For live dashboard:
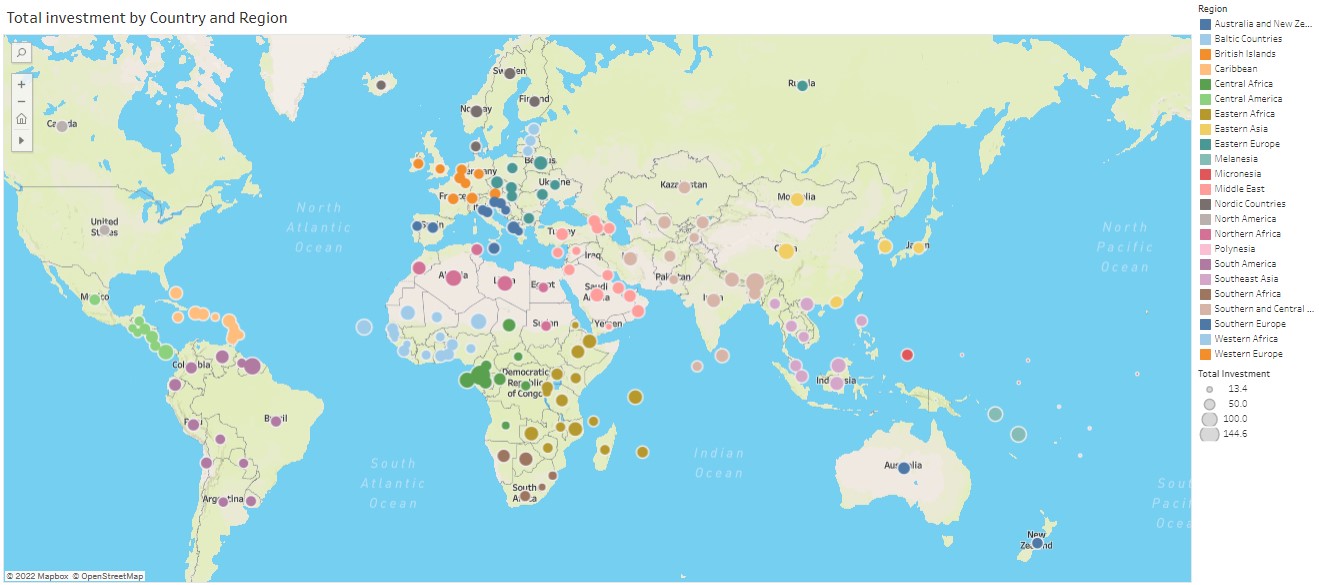
8- Finally, the Map visualization show us the total investment around countries we can say that we have great investments in Africa because of the resources available in this continent, such as gold and diamond.

In conclusion, the data visualized above has shown that the country’s economy is affected by the GDP, the imports and exports, the gross saving, the government form of the country, in which continent the country is , we have seen also that the imports and exports have strong linear relation that is due to when the countries which have more imports maybe like primary materials they have more exports after reproduce these materials and make them more useful. We can add that if our business is more like goods sold and consumed, then we should target the European markets due to the stability of economy, the high GDP per capita and the high income in such countries, but in the other hand if our business is about investments and extracting primary materials then this business should be in Africa although the countries in this continent doesn’t have strong economy and have a high inflation rate and one of the smallest GDP per capita, these businesses doesn’t target the markets in these countries but they use the materials in it and reproduce it and export it to markets more stable like Europe.
