When assessing health populations across the world, life expectancy is considered to be the key metric of evaluation as it captures the mortality along the entire life course. It is a statistical measure of the average time an organism is expected to live based on several factors. Thus, life expectancy should be considered carefully especially by teenagers because they’re in an age where they start to realise the importance of every single thing around. It is essential to be studied as it helps in distinct fields such as life insurance, pension planning, comparing countries and other social security benefits. The following study is applied on 193 different countries around the world extracted from « Kaggle » and analyzed using PowerBI.
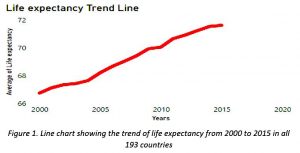
Life Expectancy Trend
In the pre-modern world, life expectancy was estimated to be around 30 years across regions of the world. However, in the early 19th century it rapidly swelled in countries who witnessed the industrial revolution. Over and over the years, an increase was driven mainly by improvements in sanitations , housing and education , causing a steady decline in early and mid-life mortality which was chiefly due to infections. This trend continued with the development of vaccines and antibiotics. Starting in the 2000s reaching 2015, it increases from around 66 years to 72 years as seen in the below graph. This number would also keep rising because awareness from generation to generation is getting better when it comes to lifestyles and healthcares.
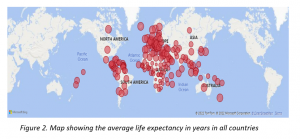
Measures of Life Expectancy around the Countries
As we all know, life expectancy varies from one geographical area to another and it even changes by era. Not every country has the same specializations, one can differ from another. If we think about Africa , most of its countries have poor healthcare and education systems, thus the life expectancy there would be low. On the other side , progress in other countries such as Europe resulted in increasing the life expectancy because of several features like access to healthcare , economical status and education. However, not all regions in the same country can be counted to have the same LE average because features even differ from one to another.
Impact of GDP on Life Expectancy
Humanity, throughout history, has made a connection between the possession of material goods and happiness. Some studies indicate that individuals born in wealthier countries, on average, can expect to live longer than those born in poor countries. Is this true? Some countries, like Qatar and Kuwait, have very high GDP but also a large population and significant income inequality. Increases in per capita income occur mainly as a result of more wealth being accumulated in the top percentile of society which already enjoys high living standards and longevity, and as such the real effect on the country’s life expectancy would be negligible. Secondly, higher income also correlates with a number of unhealthy habits, such as tobacco and alcohol consumption and less healthy diets, which in turn leads to weakening health. That’s why if we look at the below graph we can see that the GDP average weakens after reaching a certain level, and however income gains did not translate into large change in the average life expectancy and the main reason is that lifespan doesn’t depend only on incomes even if it was very large , instead many other features mentioned before is taken into consideration.

Schooling and Life Expectancy
Whether it’s a developed country or not, life expectancy may increase with the increase of years of education as it is on the top of the features that affect it. Higher education is the key to stable and well-paid jobs where increased incomes help paying for nutritious foods , better quality housing and high quality medical care. Developing countries of course started with a low LE average to reach a high limit with the increase in education years as it reached 83 years lately as seen in the graph below, whereas developed countries that have high incomes started with a better average LE because of the specializations those countries have. In both countries , LE will keep improving with time with the awareness and experience that education will be spreading.

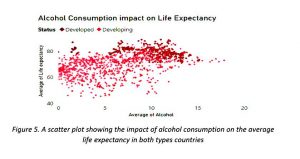
Impact of Alcohol on Life Expectancy
Drinking alcohol appears to have a complex and controversial relationship with health outcome. In contrast, studies had shown that modest drinkers-no more than one drink a day, had benefits and could gain nearly 1 year in life expectancy, in opposition to a loss of nearly 7 years if drinking more than that. That’s why alcohol and LE don’t have a clear relationship as it depends on the alcohol consumption of each person and on the lifestyle of each like exercising , quality of food ,smoking,etc. If we take the below scatter plot as an example, there is no obvious relation for both countries eventhough the liters of alcohol consumption is increasing. This verifies the impact of the mentioned factors on the consumption.
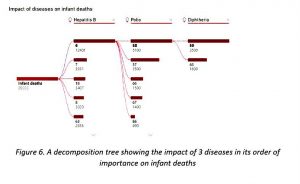
Impact of Diseases on infant deaths
Infant deaths are mostly resulted from diseases because their bodies aren’t ready enough to face them as adults can. That’s why , most children are always recommended to be immunized against some diseases , in addition to be fed with some specific vitamins when in need. But , immunizing doesn’t mean that this will never affect the child , however it may be harmful to his body type and which results in death. In the following decomposition tree , we can see the number of infant death explained by diseases was around 89033 in all the countries in those 15years. For instance , 12401 of the total population were immunized only 6% against Hepatitis B over one year. 6% is a very low number as for sure we have a big chance of getting the disease. The number of deaths decrease with the increase of the percentage of immunization coverage among 1 year old. This is the case for all diseases. Also , based on the available data , the following tree shows the order of the impact of diseases in death represented by : Hepatitis B , Polio and finally Diphteria.
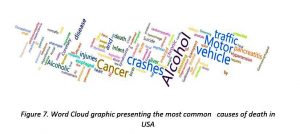
Real Example in USA
As mentioned before , specializations differ from one country to another depending on the quality of each. Africa and USA is a good example to compare. The word cloud graph below is analysed from different dataset also extracted from « Kaggle » and it shows the most common reasons that causes death in USA. The results showed that the mains are alcohol attributable followed by other acute causes such as cancer and motor traffic crashes. However, this is of course not the case in other countries like Africa for instance where they have many diseases that can cause death like Malaria,HIV/AIDS, etc.
“Life expectancy would grow by leaps and bounds if green vegetables smelled as good as bacon” is a well known quote by Doug Larson. He describes life expectancy very well in a way it needs to be watered to bloom exactly as what this study showed. To sum it all up , we all wish to live longer to be able to pass by all adventures that God hide for everyone of us. Several features are our choice – We decide if we want to exercise or not! We only decide the amount of alcohol we need to drink! We decide whether we want to smoke or not! We decide the quality of food we want to eat! Our health is our choice ,then don’t neglect it. When it comes to Education, it’s also one of our choices if it is well provided in the country we live in. Other factors like diseases and incomes are not options in our hands, however we can contribute to their improvements. According to our study, all those factors together have an impact on life expectancy , thus better held them all well in our minds and enjoy life. LIVE LESS OUT OF HABIT AND MORE OUT OF INTENT!

This was an interesting read!
The article on life expectancy provides valuable insights into the factors affecting our longevity. It highlights the
significance of lifestyle choices in determining how long we live. Great article!