In this study, using base R for analysis and visualization, we talk about the effects of alcohol consumption on the academic performance of students in Portugal, and the influence that their parents might have on them. The data used in this study was collected from two different schools in Portugal in 2008, and it contains several factors of the students’ lives.
Insight on the data:
https://www.kaggle.com/datasets/whenamancodes/alcohol-effects-on-study
The alcohol consumption of the students is displayed by “Dalc” (during weekdays) and “Walc” (during weekends) with a scoring system that goes from 1 to 5 (from low to high levels of consumption).
First, let’s start by visualizing the grades (G1) of the students:
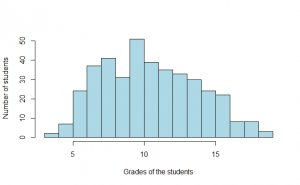
It’s normally distributed with a mean of 10.9, which means that the average student tends to get grades that are slightly above average.
Second, let’s see the effect of the consumption of alcohol on the students’ grades.
To begin, let’s see the levels of alcohol that are being consumed during the week:
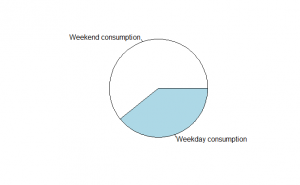
We clearly see that the consumption on the average weekend day is roughly twice as much of the average weekday. Students tend to drink more on weekends.
Now to see the ages of the students’:
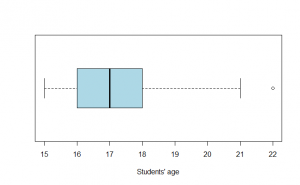
This study was conducted on students of ages 15 to 22, but mostly contains 16- to 18-year-olds students. You might be asking yourself how children this low of age are allowed to drink, it’s because the legal age to consume alcohol in Portugal is 16 which is relatively low.
To see the direct relation between alcohol and students’ performance lets visualize this plot:
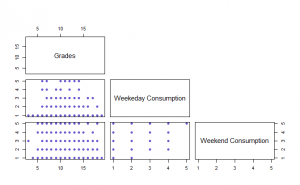
We clearly see that the higher the consumption is (5) the less the number of high grades get and vice versa. Which indicates that the alcohol consumption affects the students’ performance.
It has been scientifically proven, that students who consume alcohol within 48 hours of the exam tend to score less than the others who didn’t consume any at all.
Third, let’s check the influence of parents on the students’ performance according to their level of education:
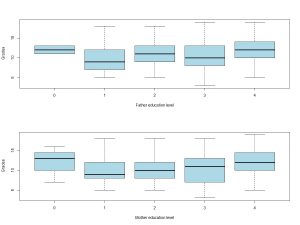
We observe that parent’s level of education is not effective enough when it comes to their child’s grades thus the education culture of the parents doesn’t matter a lot. But we do see significant values in the students’ grades when it comes to parents who have 0 for level of education (most of them are a stay-at-home parent who might have more time to help in their child’s education thus this explains the higher averages).
Forth, I set up a regression model to see what other environmental factors mostly affects the students’ grades, and family size was one of the variables along with alcohol consumption levels has the greatest coefficients when it came to predict the students’ grades.
Thus, let’s visualize the family size influence on the grades of the students:

We see in this histogram, that students with greater than three of family members (GT3) are more successful than the students than have three or less member in their family (LE3).
In conclusion, the biggest factor that affect the students’ grades is their alcohol consumption, then comes their family size. Although it is believed that the parents play a big role in their child’s education, but this role is not defined by their level of education but the time they give to their children. The solution to the alcohol problem might be solved if the legal age to drink was incremented, thus leading to less consumption by the students, thus better grades.

Thank you !!!! So I have to avoid alcohol during exam periods 😉 🙂
I followed your advice and stopped drinking alcohol before the test, but unfortunately, I failed the test ??