University rankings are often used by students, parents, employers, and academic institutions to compare universities around the world. However, a ranking number alone does not explain why some universities appear at the top while others are ranked lower. The QS World University Rankings 2025 dataset gives us the opportunity to look beyond the final rank and explore the factors that may influence university performance.
This article analyzes the QS World University Rankings 2025 using data visualization. The main goal is to answer one question:
What factors are most related to a high QS Overall Score?
The analysis focuses on universities that have a reported QS Overall Score. After cleaning the dataset and removing rows without an overall score, the final dataset contains 600 universities.
This article is based on the QS World University Rankings 2025 dataset, which was used to explore how universities are represented and compared at a global level. For more context, readers can visit the official QS World University Rankings website and also explore other data visualization projects published on the master’s blog.
Top Universities in the QS World University Rankings 2025
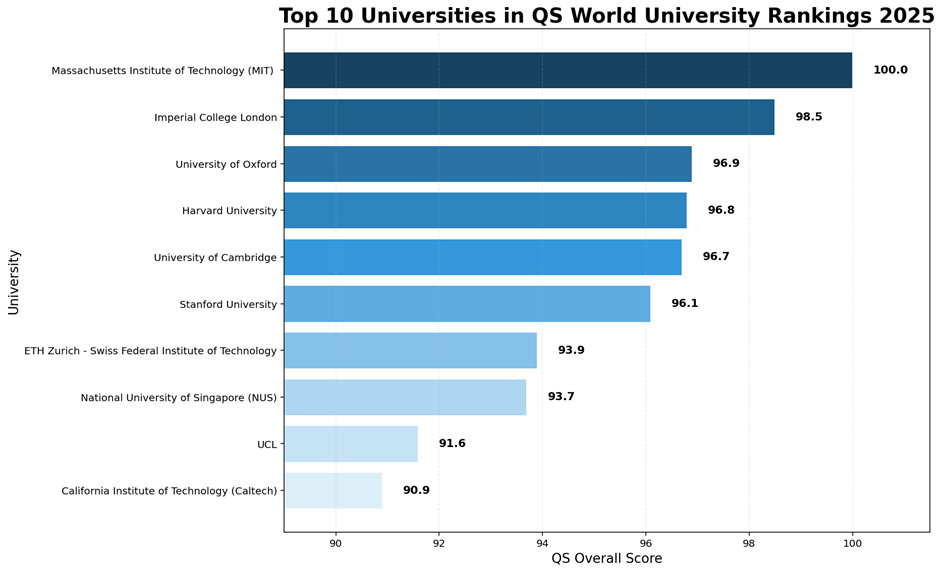
First, the chart shows that Massachusetts Institute of Technology (MIT) ranks first with a perfect QS Overall Score of 100.0. It is followed by Imperial College London, University of Oxford, Harvard University, and University of Cambridge.
A clear pattern appears among the highest-ranked universities: many of them are located in the United States and the United Kingdom. These two countries continue to dominate the top positions in global higher education. For example, universities such as MIT, Harvard, Stanford, Oxford, Cambridge, Imperial College London, and UCL show the strong international reputation of American and British universities.
Takeaway:
The top of the QS 2025 ranking is dominated by globally recognized universities, especially from the United States and the United Kingdom.
Country Representation in the QS World University Rankings 2025
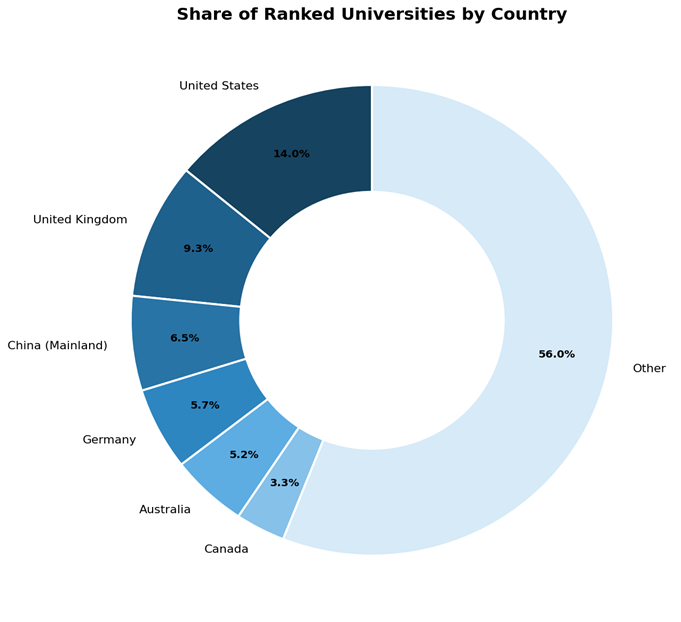
After looking at the top universities, the next question is: which countries have the largest share of ranked universities?
The donut chart shows the share of ranked universities by country. The United States has the largest individual share, followed by the United Kingdom, China Mainland, Germany, Australia, and Canada. However, the largest part of the chart is still grouped under “Other”, which represents all remaining countries.
This result tells an important story. While a few countries have a strong presence in the ranking, the QS ranking is still globally diverse. Many universities come from countries outside the largest education markets.
For example, the United States represents 14.0% of the ranked universities, while the United Kingdom represents 9.3%. China Mainland follows with 6.5%, Germany with 5.7%, Australia with 5.2%, and Canada with 3.3%. The remaining countries together represent 56.0%.
Takeaway:
The United States and the United Kingdom are strongly represented, but more than half of the ranked universities come from other countries.
University Size in the QS World University Rankings 2025
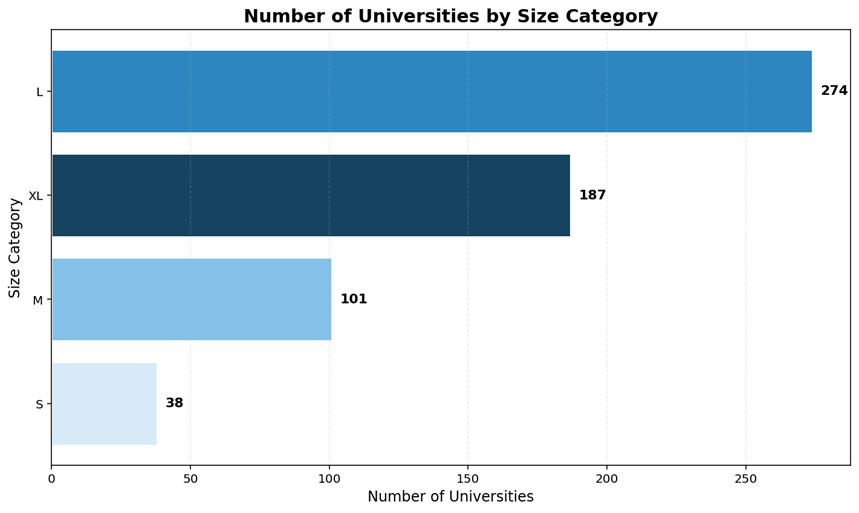
The next visualization looks at university size categories.
The chart shows that most ranked universities are classified as large or extra-large. There are:
- 274 large universities
- 187 extra-large universities
- 101 medium universities
- 38 small universities
As a result, larger universities appear more commonly in the QS ranking. Larger institutions may have more research output, more international partnerships, larger alumni networks, and higher global visibility. These factors can help universities perform better in ranking systems that consider reputation, research, and international impact.
However, size alone does not guarantee a high ranking. A university still needs strong performance in academic reputation, employer reputation, research impact, and other indicators.
Takeaway:
Large and extra-large universities make up most of the ranked institutions, but size is only one part of the ranking story.
QS Overall Scores: Most Universities Are Far from the Top
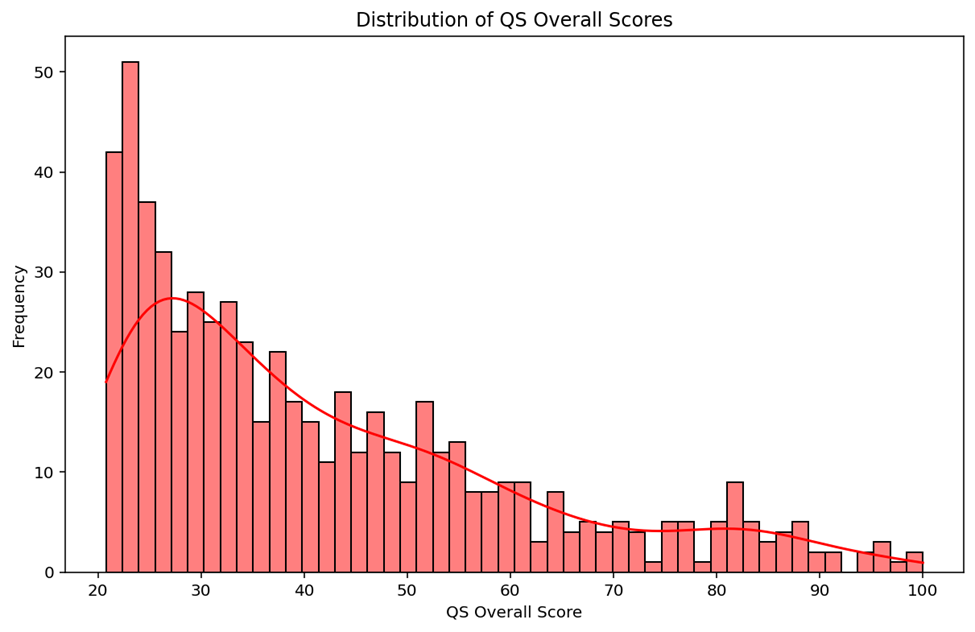
The distribution of QS Overall Scores helps us understand how scores are spread across the dataset.
The histogram shows that most universities have QS Overall Scores between around 20 and 40. Only a small number of universities reach scores above 80, and very few approach the maximum score of 100.
Therefore, the ranking is not evenly distributed. There is a small group of elite universities at the top, while most ranked universities are clustered in the lower and middle score ranges. The gap between the top universities and the rest of the ranking is clear.
This point is important because it shows that being ranked does not mean all universities are close in performance. The difference between a top 10 university and a lower-ranked university can be very large in terms of overall score.
Takeaway:
Most QS-ranked universities have moderate scores, while only a small group reaches very high overall scores.
Factors Related to QS Overall Score
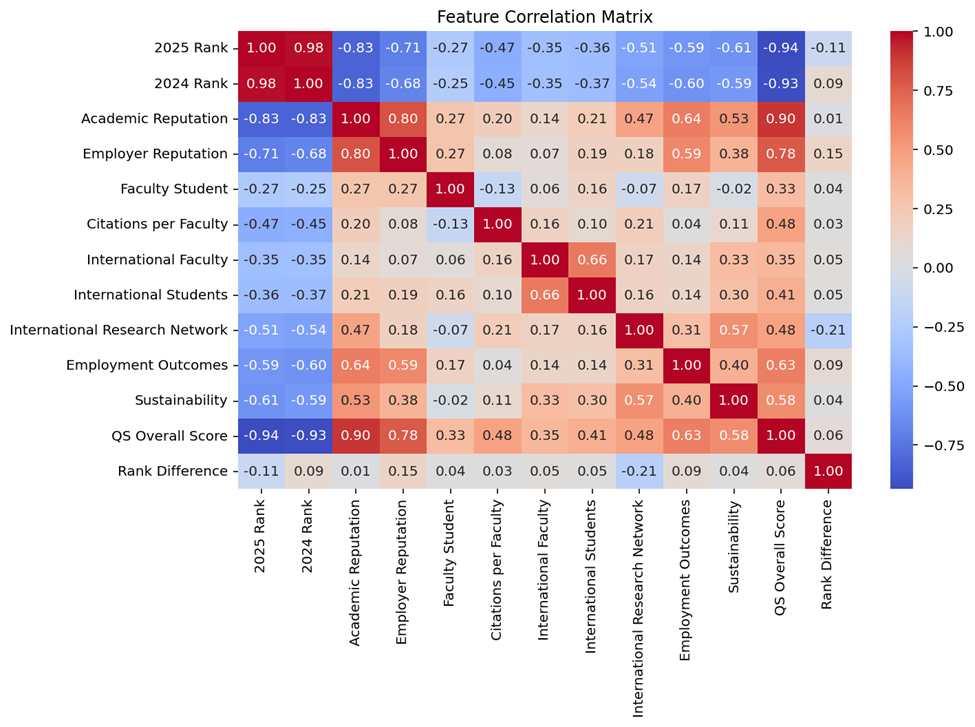
To understand what drives a high QS Overall Score, the correlation matrix compares the relationship between different ranking indicators.
The correlation matrix shows that Academic Reputation has the strongest positive relationship with QS Overall Score. It has a correlation of about 0.90 with the overall score. This means that universities with higher academic reputation usually have higher overall QS scores.
Moreover, the second strongest relationship is Employer Reputation, with a correlation of about 0.78. This suggests that how employers view a university’s graduates is also highly connected to the final QS score.
Other indicators also show positive relationships with the QS Overall Score, including:
- Employment Outcomes
- Sustainability
- Citations per Faculty
- International Research Network
However, these relationships are weaker than Academic Reputation and Employer Reputation.
Overall, this suggests that QS rankings are strongly influenced by reputation-based indicators. Research, internationalization, and sustainability matter, but reputation appears to play the largest role.
Biggest Movers in the QS World University Rankings 2025
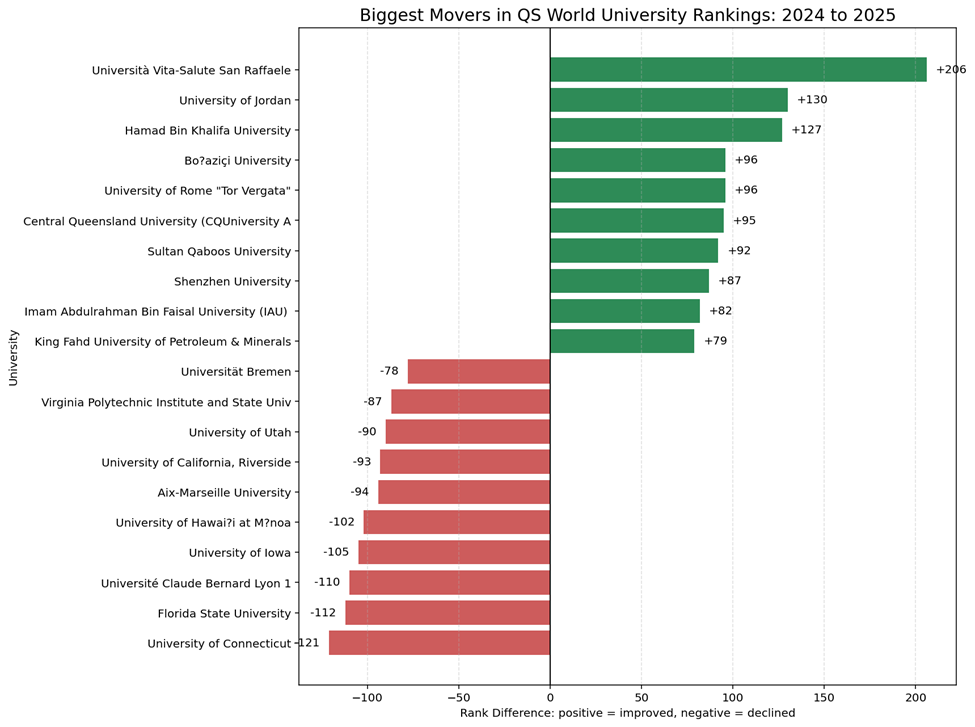
The final visualization focuses on the biggest ranking movements.
This chart shows the universities with the largest positive and negative rank differences. Positive values indicate improvement, while negative values indicate decline.
For example, Università Vita-Salute San Raffaele shows the largest improvement in the chart, moving up by 206 positions. Other universities such as the University of Jordan, Hamad Bin Khalifa University, and Boğaziçi University also improved significantly.
On the other side, some universities declined in rank. The University of Connecticut, Florida State University, Université Claude Bernard Lyon 1, and the University of Iowa appear among the largest declines.
Finally, this visualization is useful because it makes the ranking more dynamic. It shows that rankings are not fixed. Universities can improve or decline depending on changes in performance, reputation, research output, international visibility, or ranking methodology.
Conclusion
The QS World University Rankings 2025 reveal more than just a list of universities. Through data visualization, we can see patterns in global higher education, country representation, university size, score distribution, ranking movement, and performance indicators.
The analysis shows that the highest-ranked universities are mostly concentrated in the United States and the United Kingdom. These countries have both strong representation and many universities at the top of the ranking. At the same time, the donut chart shows that universities from many other countries also contribute to the global ranking.
In addition, the distribution of QS Overall Scores shows a clear gap between elite universities and the rest of the ranked institutions. Most universities have moderate scores, while only a small number reach very high scores.
The most important finding is that Academic Reputation appears to be the strongest factor related to QS Overall Score. Employer Reputation and Employment Outcomes are also strongly connected to the overall score. This suggests that QS rankings are not based only on measurable academic performance, but also on how universities are perceived by academics and employers.
Finally, the ranking movement charts show that most universities had small changes between 2024 and 2025, but some institutions improved or declined significantly.
