Exploring the Emotional and Behavioral Impact of Weather Through Data Visualization
Have you ever noticed how a rainy day changes your mood? Or how sunny weather suddenly increases your energy and motivation?
Weather is usually associated with temperature and climate, but its effects may go far beyond the environment itself. Different weather conditions can influence emotions, productivity, comfort, and even the activities people choose during the day.
Using a synthetic dataset generated with Python, this project explores how weather conditions shape emotional and behavioral patterns through storytelling and data visualization techniques. By transforming emotional metrics into visual insights, hidden behavioral trends begin to emerge beneath the forecast.
1: Emotional Forecasts Beneath the Weather
Our story begins with an emotional heatmap comparing weather conditions with emotional indicators such as energy, calmness, comfort, stress, and nostalgia.
The visualization reveals that sunny weather produced the highest energy levels, suggesting stronger motivation and emotional activity during bright conditions. Rainy weather, however, appeared associated with higher calmness and comfort levels, creating a more relaxing emotional atmosphere.
Stormy weather showed noticeably higher stress levels, while foggy conditions reflected more nostalgic emotional patterns. These differences suggest that weather conditions may shape emotional experiences in distinct ways.
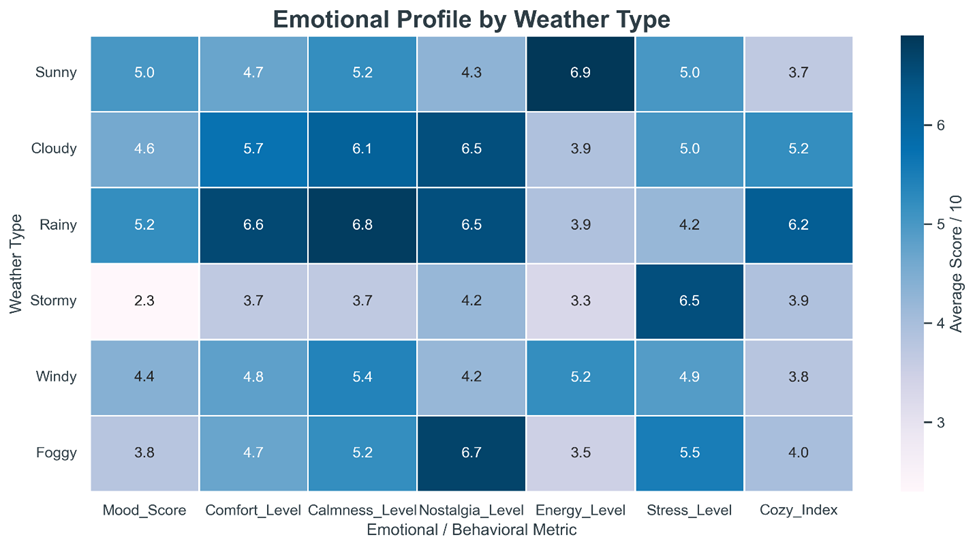
Graph 1: Emotional responses across different weather conditions
2: Productivity Under Different Skies
After exploring emotions, the next question becomes whether weather also influences productivity.
The productivity bar chart shows that sunny weather generated the highest average productivity levels. This may be connected to increased energy, stronger focus, and higher motivation during clear weather conditions.
Stormy weather, on the other hand, produced lower productivity levels, suggesting that unstable environmental conditions may negatively affect concentration and performance. Cloudy and foggy weather appeared more balanced, positioned between high and low productivity extremes.
The visualization demonstrates that weather may influence not only emotions, but also daily performance patterns.
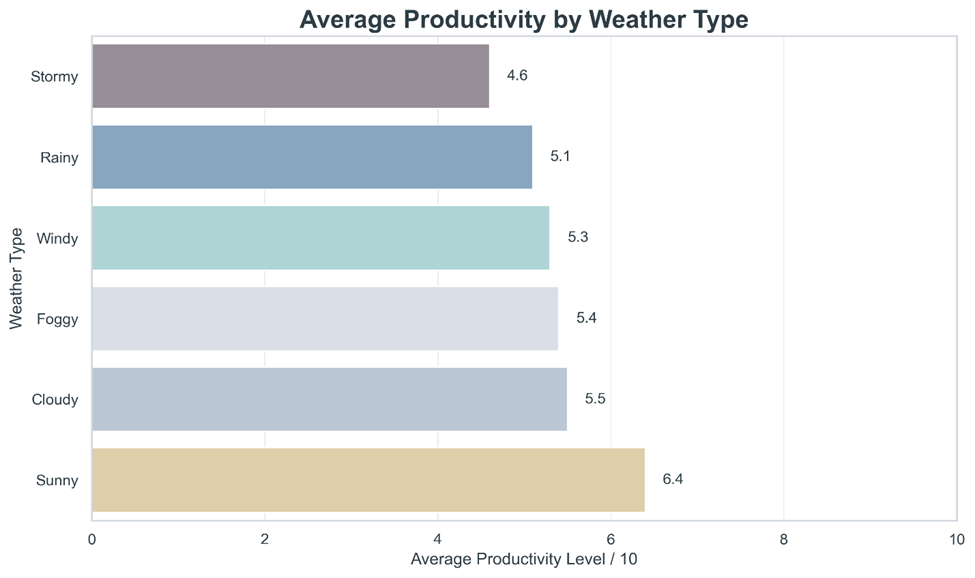
Graph 2: Average productivity levels across weather conditions
3: Mapping Mood and Productivity Patterns
To better understand emotional-performance relationships, a scatter plot was used to explore mood, productivity, comfort, and weather conditions together.
In the chart, points appearing higher represent stronger productivity levels, while points farther to the right indicate higher mood scores. Bubble sizes represent comfort levels, and colors represent different weather types.
A clear positive relationship appears between mood and productivity. Sunny weather points frequently appear closer to the upper-right area of the graph, suggesting higher mood and stronger productivity patterns. Larger bubbles also indicate that higher comfort levels may positively influence emotional and behavioral performance.
This visualization highlights how emotional state, comfort, and productivity interact under different weather conditions.
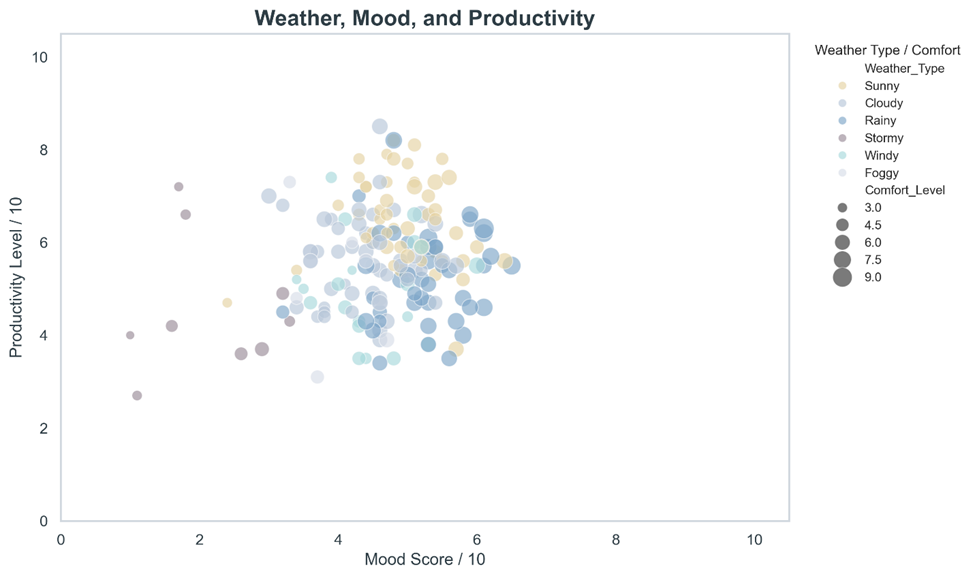
Graph 3: Relationship between mood, productivity, comfort, and weather
4: The Comfort of Rainy Days
Comfort and relaxation were further explored using a box plot comparing cozy index values across weather types.
The visualization shows that rainy weather produced the highest cozy index levels overall. The higher position of the rainy box indicates stronger comfort and relaxation patterns associated with rainy conditions.
Cloudy weather also displayed elevated comfort levels, while stormy and windy conditions produced noticeably lower cozy scores. Interestingly, sunny weather generated high productivity without producing the highest comfort, suggesting that emotional energy and emotional relaxation are not always connected.
This visualization demonstrates that weather may influence comfort differently from productivity or emotional stimulation.
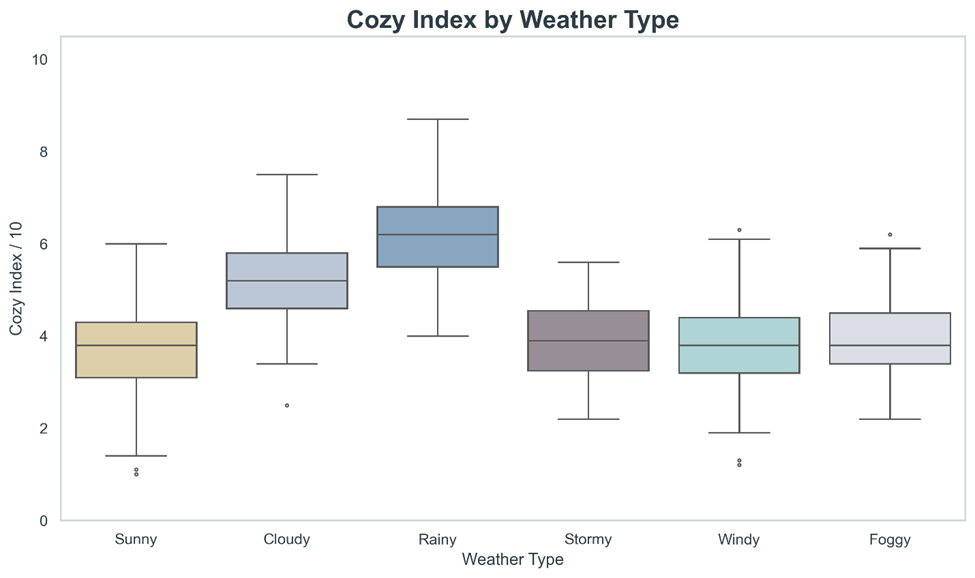
Graph 4: Cozy index distribution across weather conditions
5: When Weather Changes Daily Activities
The final visualization explores how weather conditions shape people’s daily activities and lifestyle choices.
The activity heatmap reveals that sunny weather strongly encouraged outdoor activities such as walking and café visits. Higher energy levels and positive mood patterns may explain these active behaviors.
Rainy and stormy weather shifted behavior indoors. Watching movies and relaxing activities became strongly associated with harsher weather conditions, reflecting calmer and more comfortable indoor routines.
This visualization demonstrates that weather influences not only emotional states, but also everyday behavioral decisions and lifestyle habits.
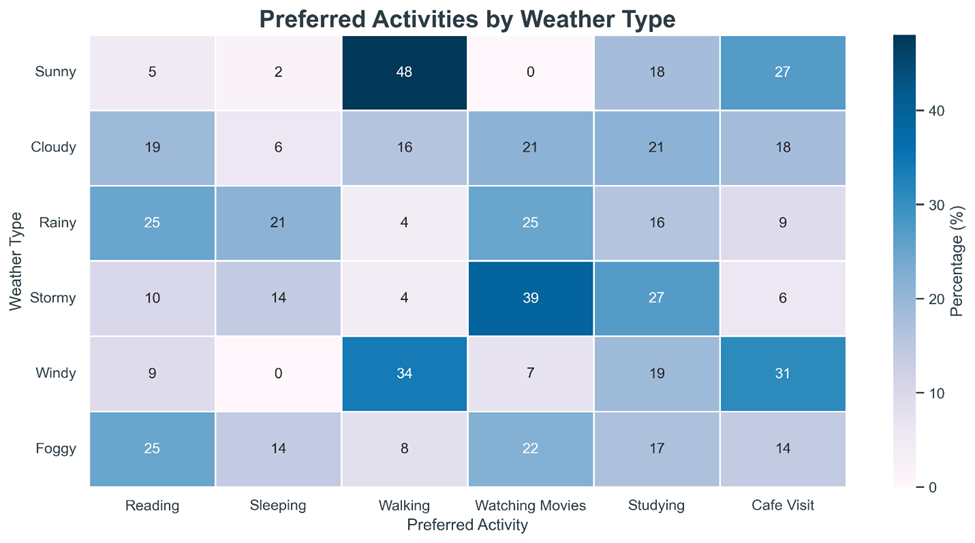
Graph 5: Daily activities across weather conditions
6: Final Insights Beneath the Forecast
The visualizations reveal a consistent emotional and behavioral story.
Sunny weather appeared associated with higher energy, motivation, and productivity. Rainy weather encouraged calmness, comfort, and relaxation, while stormy weather reflected higher stress levels and lower productivity patterns.
Daily activities also shifted depending on weather conditions, moving between energetic outdoor behaviors and calmer indoor routines.
Although the dataset was synthetically generated using Python, the visual patterns reflect realistic emotional experiences commonly associated with changing weather conditions.
In the end, weather may not completely control how people feel or behave — but the data suggests it certainly leaves its mark.
When the weather changes, so do we.
