When Music Becomes Data
Why do some songs become global hits while others disappear after a few weeks?
At first, the answer seems simple. Maybe hit songs are more danceable. Maybe they are more energetic. Maybe they sound happier. Or maybe success has less to do with the song itself and more to do with the artist, playlists, and visibility.
This project is based on one main question:
Do popular songs share a common DNA?
To explore this question, a 2023 Spotify songs dataset was used. It contains information about track names, artists, streams, playlist presence, and several audio features such as danceability, energy, valence, acousticness, speechiness, and liveness.
The goal was not only to analyze the data, but also to turn it into a visual story. The data was cleaned and prepared using Python in VS Code. Then, Flourish Studio was used to create interactive visualizations that explore the hidden patterns behind music popularity.
1. From Raw Spotify Data to a Visual Story
Before creating the visualizations, the data had to be prepared.
The original dataset contained columns such as song title, artist name, release date, streams, playlist counts, and audio characteristics. Some values were stored as text, especially large stream numbers. For example, a stream count could appear as text and needed to be converted into a real number before analysis.
The column names were cleaned, numerical columns were converted, and new variables were created to make the story easier to understand. For example:
- streams_billions: total streams divided by one billion
- energy level: low, medium, or high
- mood category: sad/dark, neutral, or happy/positive
- success level: lower streams, medium streams, or high streams
This step was important because raw data is not always ready for visualization. A good visual story starts with clean and well-structured data.
2. The DNA of a Hit Song
The first visualization explores the musical profile of songs.
Three groups were compared:
- all songs in the dataset
- the top 50 most-streamed songs
- the lower-stream songs
The radar chart uses six audio features: danceability, energy, valence, acousticness, speechiness, and liveness.
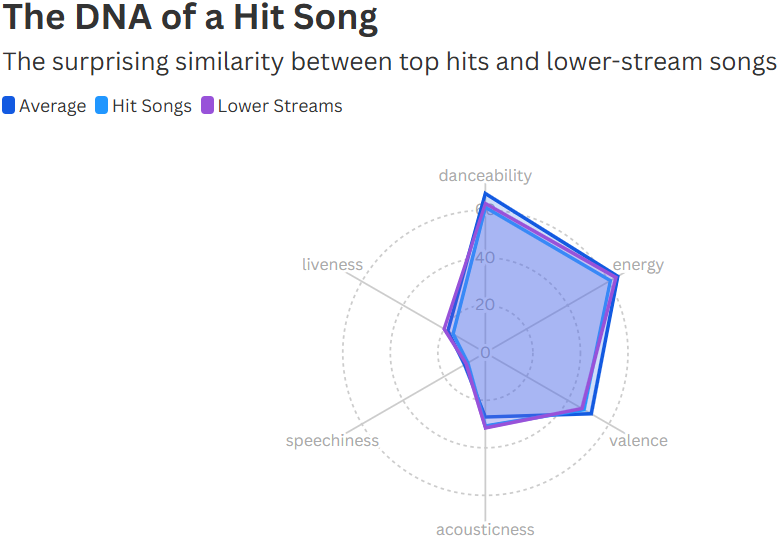
At first, top hits might be expected to look very different from the rest. They might be expected to be much more danceable, more energetic, and more positive.
But the radar chart shows something surprising: the profiles are very similar.
This means that the biggest hits are not successful only because they are more danceable or more energetic. Audio features matter, but they do not fully explain popularity. This first result already shows that the “formula” of a hit song is more complex than expected.
3. Does Danceability Really Create a Hit?
Danceability is one of the most intuitive features to study. When a song is catchy and easy to move to, it is often assumed to have a better chance of becoming popular.
To test this idea visually, a bubble chart was created.
Each bubble represents one song. The horizontal axis shows danceability, and the vertical axis shows streams in billions. The size of the bubble represents Spotify playlist visibility, while the color represents the song’s energy level.
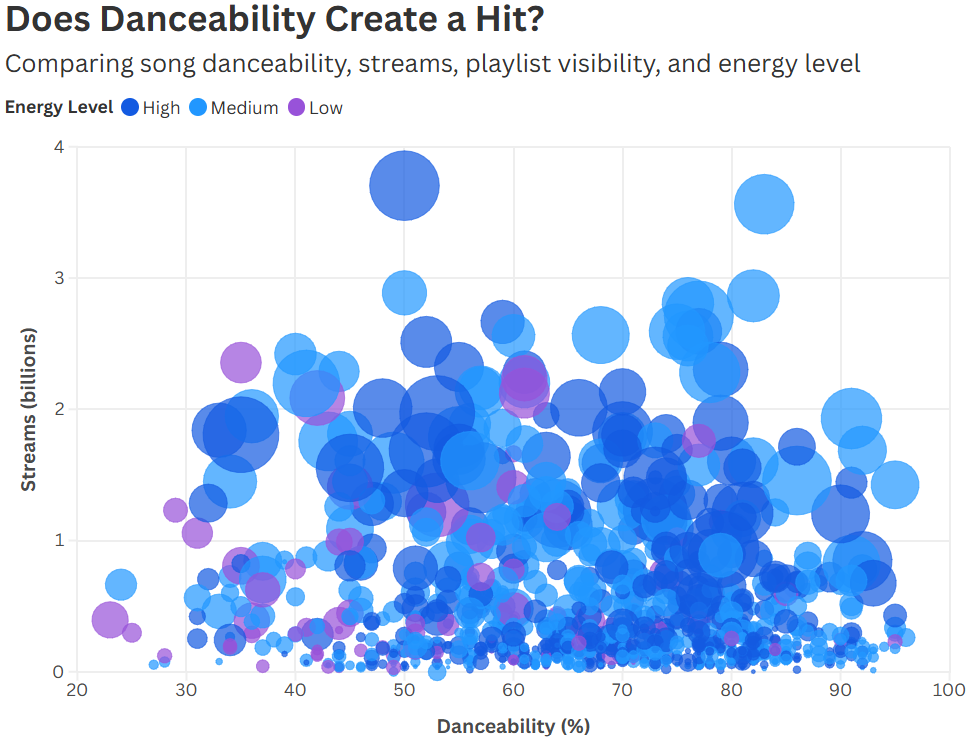
The result shows that danceability helps, but it is not enough.
Some very danceable songs have high streams, but not all of them. At the same time, some songs with medium danceability still reach very high streaming numbers. This shows that danceability is part of the story, but it is not the complete explanation.
Playlist visibility also appears important. Larger bubbles often represent songs that are present in many Spotify playlists. This suggests that exposure matters: a song can have good musical qualities, but it also needs to be seen, recommended, and repeated.
In other words, a hit song is not only made by sound. It is also made by circulation.
4. From Energy and Mood to Success
The next step was to look at the emotional side of music.
Songs were grouped by energy level and mood category. Energy was classified as low, medium, or high. Mood was based on valence, which represents how positive or negative a song sounds. Songs with lower valence were classified as sad/dark, middle values as neutral, and higher values as happy/positive.
To show the relationship between these categories and streaming success, a Sankey diagram was used.
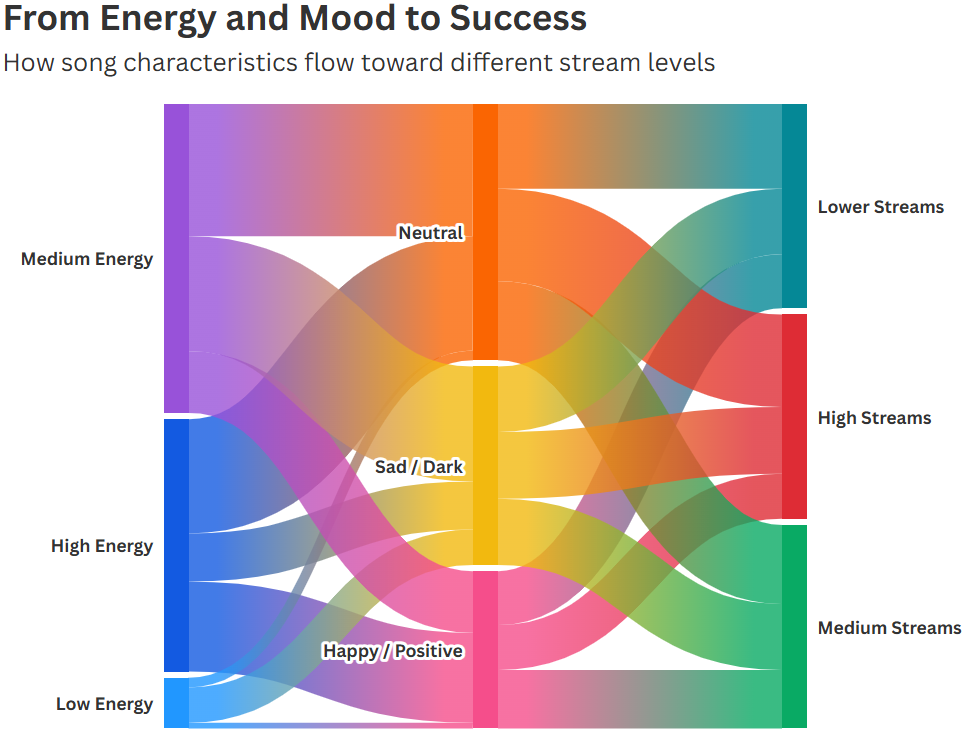
This chart shows the flow from energy level to mood, and then from mood to success level.
The important insight is that high success does not come from only one emotional category. Some successful songs are happy and positive, while others are neutral or even darker. In the same way, success does not belong only to high-energy songs.
This is important because it breaks a common assumption. Many people think a hit song must be happy, loud, and energetic. But the data shows that different emotional styles can also become successful.
A global hit can be a dance anthem, but it can also be emotional, calm, nostalgic, or dark.
5. The Biggest Hit Songs by Mood
After studying general patterns, the analysis focused directly on the biggest songs.
For this, a packed bubble chart was used. Each bubble represents one of the top-streamed songs. The size of the bubble shows total streams, and the bubbles are grouped by mood category.
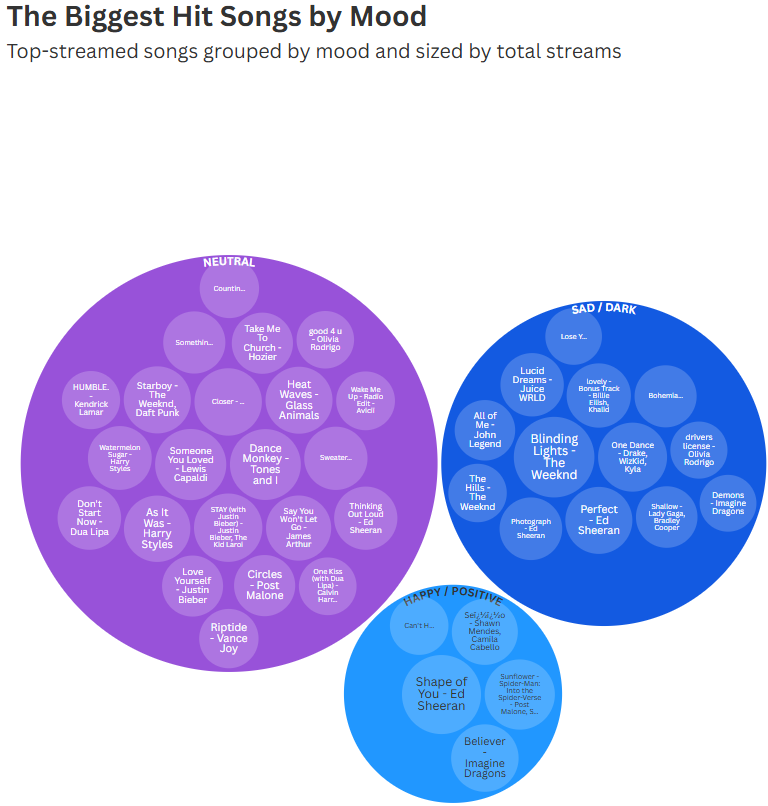
This visualization quickly shows which songs dominate the dataset. It also makes the mood distribution easy to understand.
The biggest hits are not all emotionally similar. Some are neutral, some are sad/dark, and others are happy/positive. This supports the same conclusion as the Sankey chart: there is no single emotional recipe for success.
The packed bubbles also make the story more visual. Instead of reading a table of song names and stream counts, the viewer can immediately see which songs take up the most space in the music landscape.
The larger the bubble, the stronger the song’s streaming presence.
6. Artist Power: Who Dominates the Hit Song Landscape?
The final visualization moves away from songs and focuses on artists.
If audio features do not fully explain popularity, then another factor must be considered: the artist behind the song.
To explore this, artists were ranked by total streams across the songs available in the dataset.
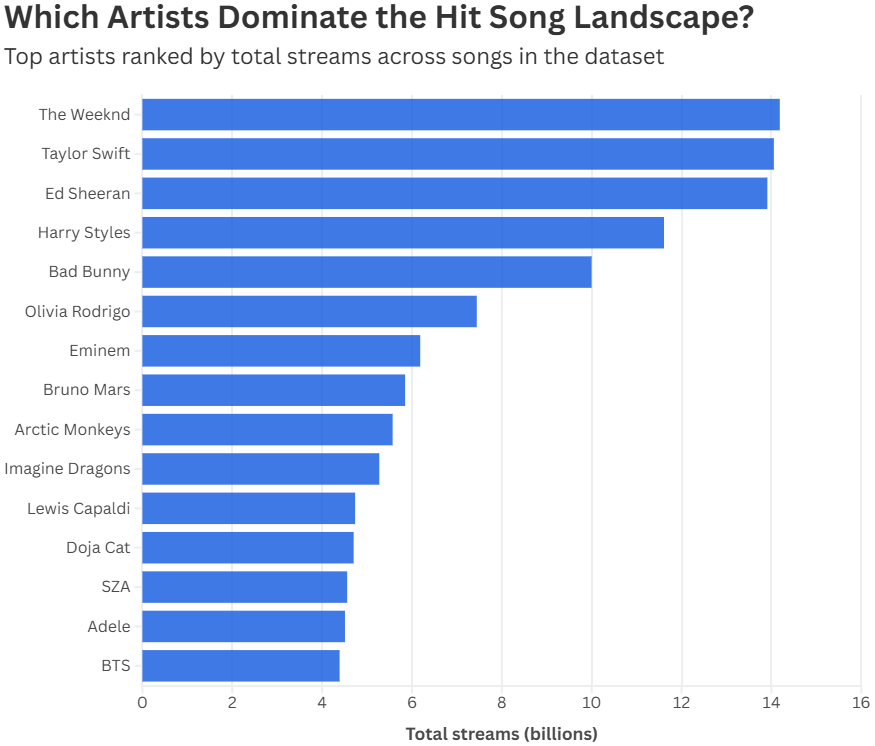
The chart shows that a few global artists dominate the dataset. Artists such as The Weeknd, Taylor Swift, Ed Sheeran, Harry Styles, and Bad Bunny appear among the strongest names.
This is a key insight. Popularity is not only about the song’s internal characteristics. It is also influenced by artist visibility, fan base, playlist placement, and cultural presence.
A song from a globally known artist has a higher chance of being noticed, shared, and streamed. This does not mean the song quality is not important. It means that music success is a combination of sound, emotion, audience, and exposure.
7. What the Visualizations Reveal
Across the five visualizations, the story becomes clearer.
The radar chart shows that top hits and lower-stream songs have surprisingly similar audio profiles. The bubble chart shows that danceability is useful, but not enough. The Sankey diagram shows that different moods and energy levels can still lead to success. The packed bubble chart shows that the biggest hits are emotionally diverse. Finally, the artist ranking shows that visibility and fan base play a major role.
Together, these visuals answer the main question:
There is no perfect formula for a hit song.
A successful song may be danceable, energetic, emotional, or positive. But none of these characteristics guarantees success alone. Hit songs are shaped by a mix of factors:
- audio features
- mood
- energy
- playlist visibility
- artist popularity
- audience reach
This is why music popularity is difficult to predict. It is not just a mathematical equation. It is a combination of data, emotion, culture, and timing.
Conclusion: Data Can Reveal Patterns, But Not the Whole Mystery
So, can data reveal the secret formula of a hit song?
The answer is: partially.
Data can show hidden patterns. It can help compare songs, detect similarities, and understand how features like danceability, energy, mood, and visibility interact. But data cannot fully explain why people connect emotionally with a song.
Music is not only numbers. It is memory, emotion, identity, and culture.
Still, data visualization helps show music from a new angle. It transforms streams, playlists, and audio features into a story that can be explored visually. And in this story, the most important lesson is simple:
A hit song does not have one formula. It has many possible paths to success.
Data Source and Tools
- Dataset: Most Streamed Spotify Songs 2023
- Data preparation: Python in VS Code
- Visualizations: Flourish Studio
- Visual techniques: radar chart, bubble chart, Sankey diagram, packed bubbles, and horizontal bar chart
