Super Market chains usually depends on data for them to either expand or close their branches. BIGmart, one of the largest hypermarkets and supermarkets chain, will be our case study in order to assess the current status of the brand based on data collection, to know whether it needs to expand or close its branches and if the channel type it follows today has any impact on the sales .
Outlet Contribution by Geolocation

Outlet contribution is split geographically to a point where even the shop’s location has minimal impact on sales, the small bubbles mainly come from various channels (fig.1).
BigMart is a supermarket brand which prefers to be present in “small” to “medium” size cities than more populated locations.
Sales by Tier

As per fig.2, contribution of sales in tier 3 cities represent the highest contribution at 41%, followed by tier 2 than tier 1, due to several elements, which will be revealed in the following parts.
Relation of Item Type with sales
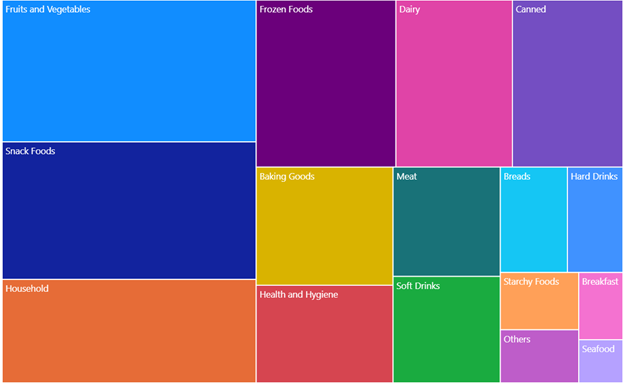
Based on fig 3, fruits & vegetables and snacks categories are generating the highest sales for BigMart, projecting the foodservice trend which is growing in demand especially in the wellness-oriented millennial snack market.
Visibility influencer
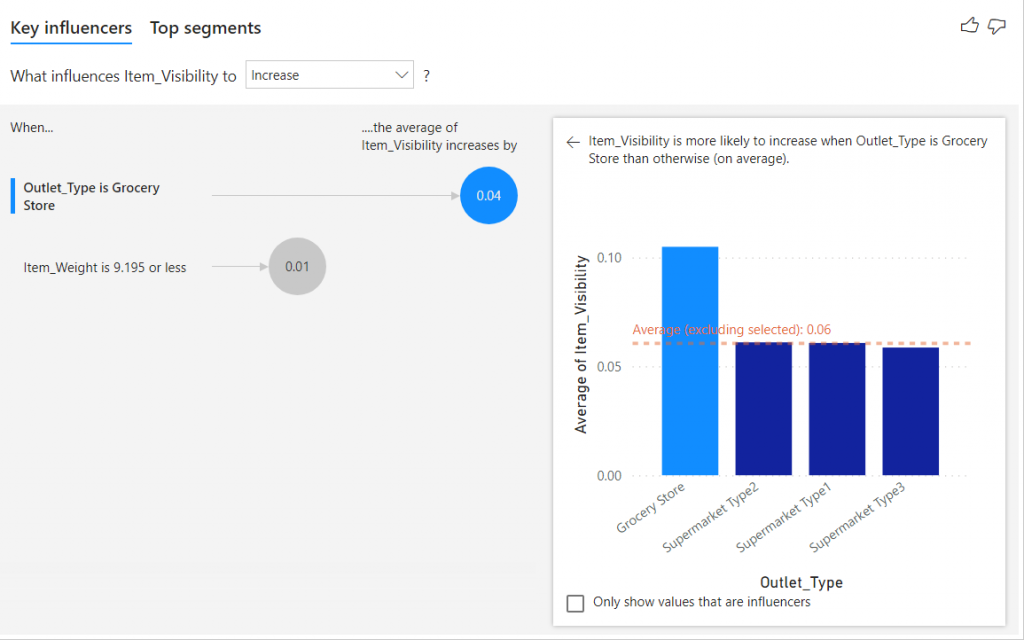
Fig 4 shows an item has a better visibility when it is sold at traditional trade channel (grocery stores) rather than modern trade (supermarkets) and this is due to the small size of the shop, the location of an item right when a customer enters a shop is more attiring than the ones placed further, items are easily identified, thus the more visible the item is the more it will generate sales.
Item weight and sales

Fig 5 is the building of a scatter plot with time series showing the item weight and sales relation with time.
Sales by channel type
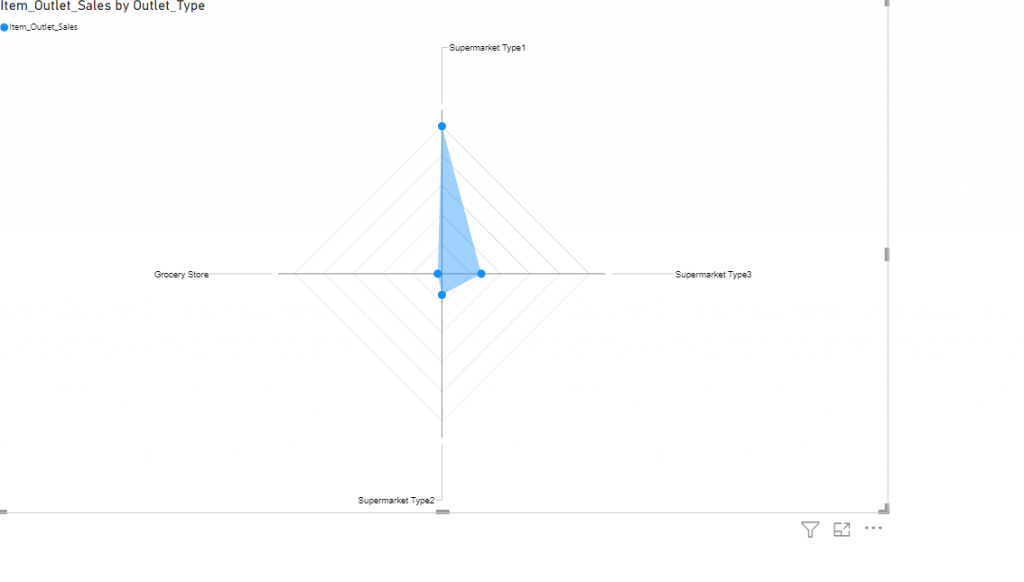
The radar graph shows that supermarkets type 1 are the biggest in terms of sales, as they represent a one-stop-shop and people would prefer to get everything from one place.
Outlets Sales number of items relation
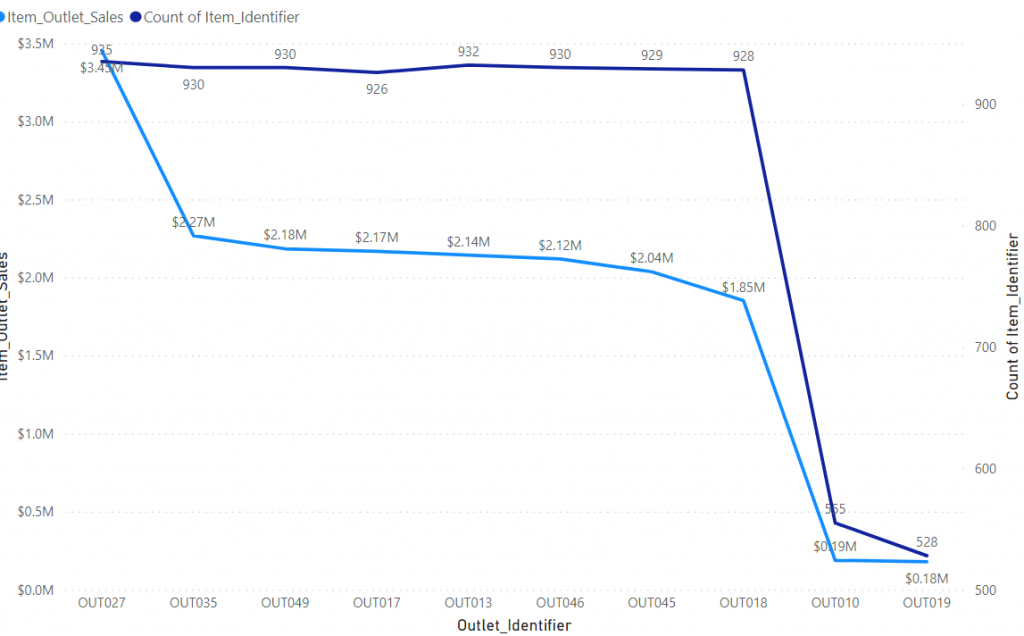
item outlet sales
As we can see in this line graph that the sales are spread among different items, the more variety of items the outlet has the more sales it generates.
Visibility & Item Sales by outlet size
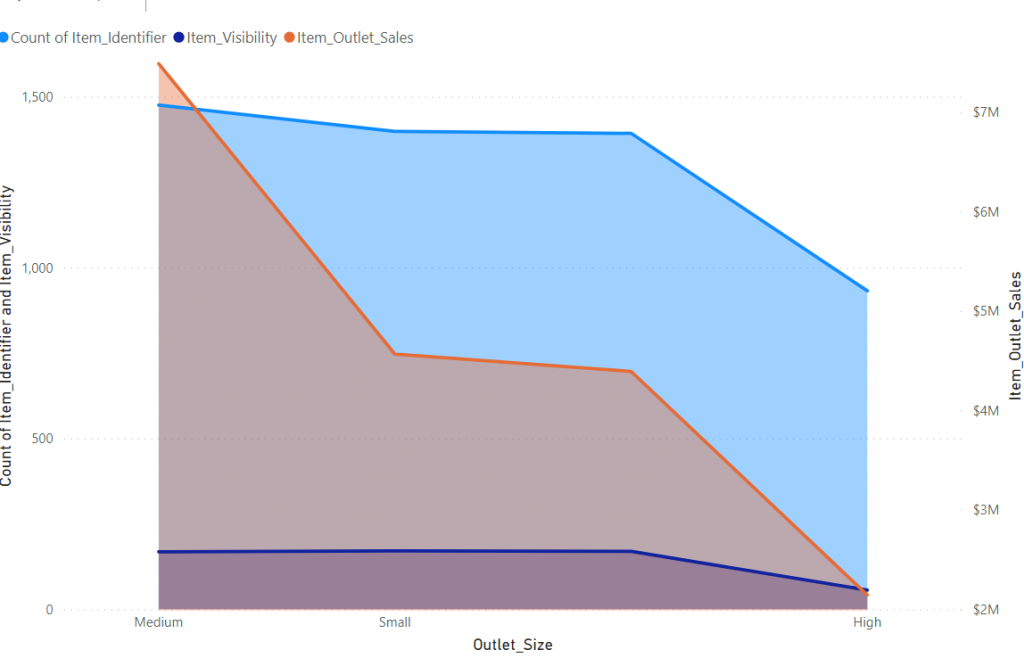
In this area graph we can see that the more items available and are visible on the physical shelf the more sales we can achieve.
Conclusion
In conclusion, for BigMart to generate more sales it has to invest in branches of medium size with more visibility and a greater number of items which fall basically under fruit/vegetables and snack categories located in tier 3 cities.
