By the end of 2019, a flu-like syndrome surfaced in Wuhan, China, before hastily propagating and reaching more and more people from different countries.
The virus, known as COVID-19, can travel between individuals via several manners. Contamination can occur as a result of touching one’s body parts such as the eyes, the nose or the mouth right after having been in contact with an infected surface.
- Data Source:
- COVID-19 Data: https://github.com/owid/covid-19-data/blob/master/public/data/README.md
- Flights Data: https://www.flightradar24.com/data/statistics
Why didn’t travel restrictions halt the virus from spreading?
The answer is simple, the disease had already infected several individuals around a seafood market in Wuhan when the travel restrictions occurred.
As per the below heat map, by the week of January 19, 2020, there were 853 recorded cases in China, 1 case in the USA and 3 cases in France.
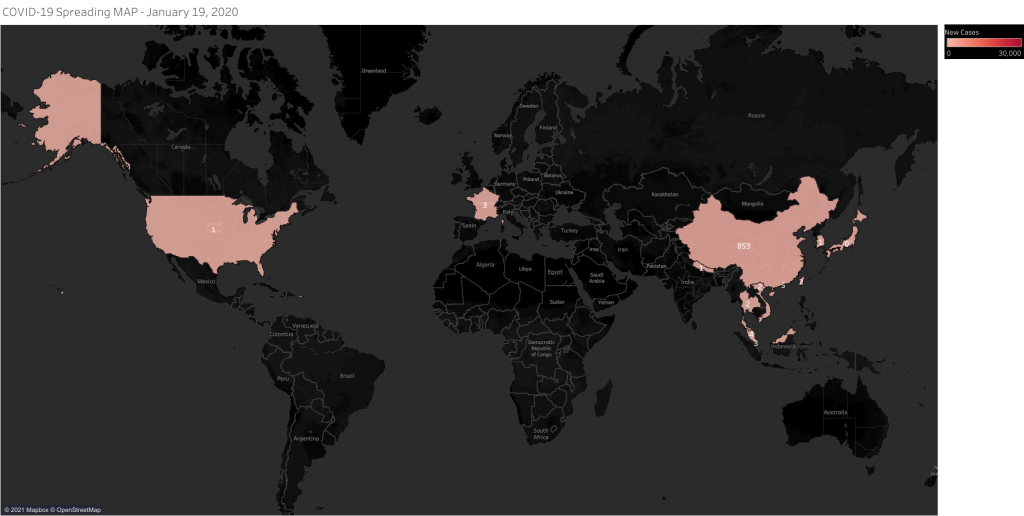
853 cases may seem low, however by February 9, 2020; two weeks after the above-mentioned date, China recorded 31,569 new cases. Approximately, the number of new cases increased 37 times.
During that time, flight travel wasn’t restricted yet. As per the below graph, between January 5, 2020, and February 16, 2020, the recorded number of worldwide flights on FlightRadar24 was 8,612,993.
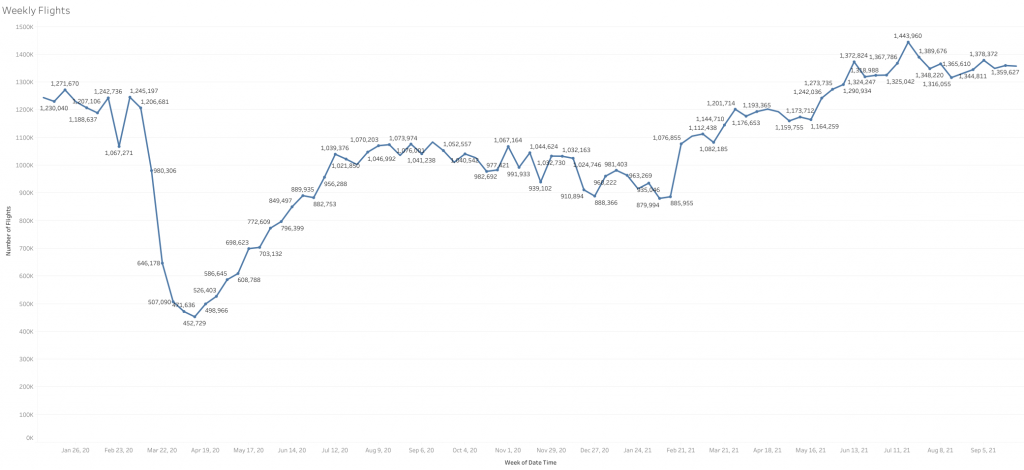
The number of weekly recorded flights decreased considerably from 1,245,197 to 452,729, after travel restrictions have been applied by early March 2020.
However, the virus was already out, and the pandemic had just begun.
By the first week of March 2020, the pandemic began its world tour. As per the COVID-19 Spreading Map, China was no longer the pilot of the outbreak.
What is a COVID-19 wave?
A rise followed by a recede in numbers of new cases of coronavirus or of deaths due to this disease, define what is called a COVID-19 wave.
Three COVID-19 waves translating the fluctuations of new cases and new deaths can be identified between March 2020 and September 2021 as per the below charts.

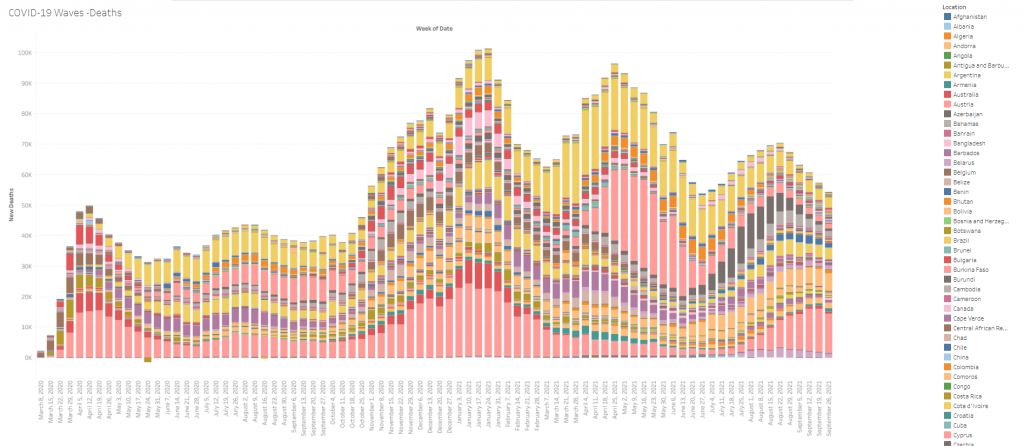
The third wave was less lethal than the previous ones and this is due to the worldwide vaccination campaigns that were launched.
Where does Lebanon stand?
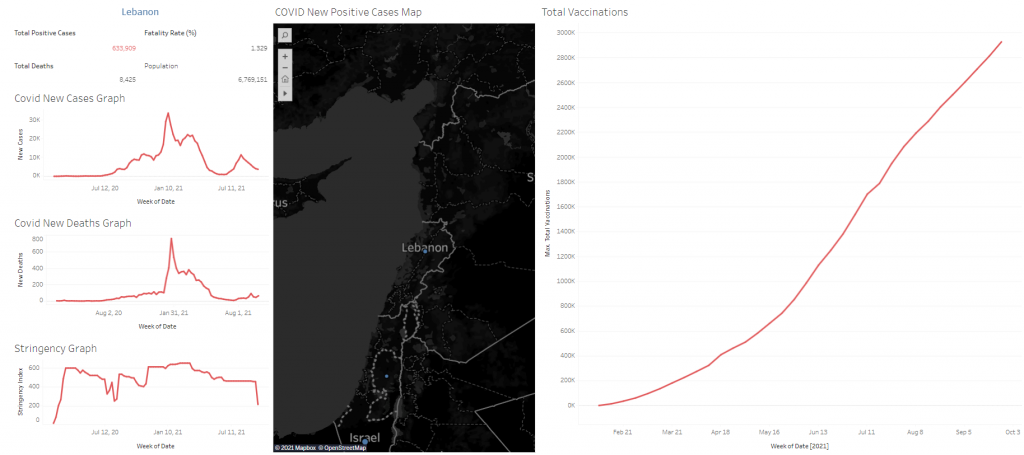
By the end of September 2021, Lebanon has recorded 633,909 positive cases.
At the beginning, during the first quarter of 2020, the lockdown restrictions imposed by the Lebanese government to help prevent the spread of COVID-19 in Lebanon were severe.
As shown in the above dashboard, during this time, the stringency index in Lebanon was high enough (~600), and the COVID-19 cases were very low.
The stringency index is a composite measure based on nine response indicators including school closures, workplace closures, and travel bans.
When the Lebanese authorities started easing its lockdown restrictions from May 2020 until early November 2020, COVID-19 cases started rising.
By January 2021, COVID-19 cases in Lebanon reached their peak. In fact, 33605 cases were detected during the second week of January.
This peak was due to:
- The ease of COVID-19 lockdown restrictions before and during the holidays.
By the end of January, and to limit the spread of COVID-19, the Lebanese authorities reapplied severe lockdown restrictions with a higher stringency index (~650) as well as severe penalties (3 months in prison and/or a fine from 100,000 to 600,000 Lebanese pound) for violators.
This severe lockdown lasted from January until the end of March 2021. After that, the Lebanese authorities started gradually easing the lockdown restrictions.
This ease of COVID-19 lockdown restrictions went along with the start of the vaccination campaign.
That is why during summer and with the ease of lockdown restrictions, the number of COVID-19 cases was greatly inferior to that of the first wave, since an important number of people took the vaccine, and the stringency index was decreased.
Is the fatality rate same everywhere?
The fatality rate is the reference number of deaths per 100 citizens that have contracted COVID-19.
As shown in the figure below, fatality rate differs from a country to another.

In Peru, with 2,185,165 total positive cases, the fatality rate is 9.1
In Lebanon, the fatality rate by September 2021 is 1.3.
Did every country feel the waves?
Not all countries went through the worldwide waves. Certain countries have avoided some waves and some other have not.
As shown in the dashboard below, South Africa went through the 3 main COVID-19 waves.
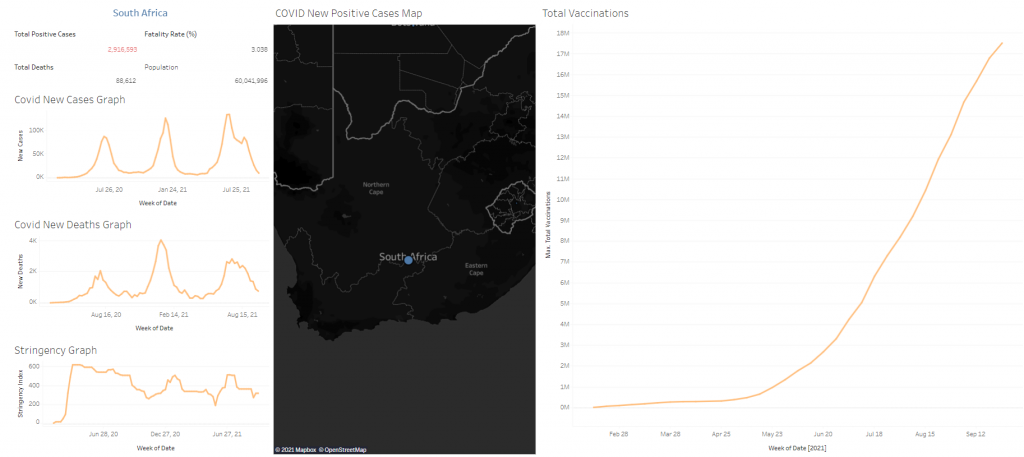
However, countries such as Hungary, avoided the third wave during summer 2021 as per the below dashboard.

What is common for most countries, is the high rate of deaths and of new cases during the second COVID-19 wave which occurred in the first quarter of 2021, and this is due to the newly detected COVID-19 variant that is highly contagious and deadly (twice as contagious/deadly as previous variants).
Conclusion
At this time, medical authorities are building up the level of vaccination worldwide.
Despite the fact that the vaccines are not 100% effective and that some fully vaccinated people will get infected and experience illness, vaccines are playing a crucial role in limiting the spread of the virus and minimizing severe infections.
