Great Businesses are built on great customer relationships. Building those relationships takes time and care, and it also requires information. You need to know who your customers are, where to find them, how to contact them, and how you can make them happy.
This whole process lies under trust. But what if the trust was broken?
Online movies have become serious business. If you are planning on going out to see a movie, How well we can trust online reviews and ratings?
Especially if the same company showing the rating also makes money by selling movie tickets.
Here we must ask:
• Do they have a bias towards rating movies higher than they should be rated?
Several sites have built popular rating systems: Rotten Tomatoes, Metacritic and IMDb each have their own way of aggregating film reviews. And while the sites have different criteria for picking and combining reviews, they have all built systems with similar values: They use the full continuum of their rating scale, try to maintain consistency, and attempt to limit deliberate interference in their ratings.
These rating systems aren’t perfect, but they’re sound enough to be useful.
It seemed nearly impossible for a movie to fail by Fandango’s standards – according to 538 articles and debates.
DESIGN & IMPLEMENTATION
-
- 1- all_sites_scores.csv contains every film that has a Rotten Tomatoes rating, a RT User rating, a Metacritic score, a Metacritic User score, and a IMDb score.
- 2- fandango_scrape.csv contains every film pulled from Fandango.
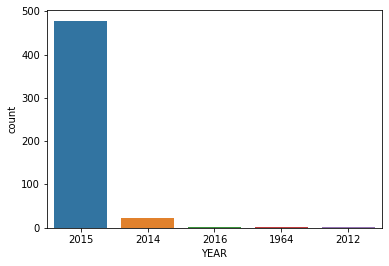
Exploring Fandango Displayed Scores VS True User Ratings to see if our analysis agrees with the article’s conclusion.

As noted in the debates, due to HTML the star rating displays, the true user rating may be slightly different than the rating shown to a user.

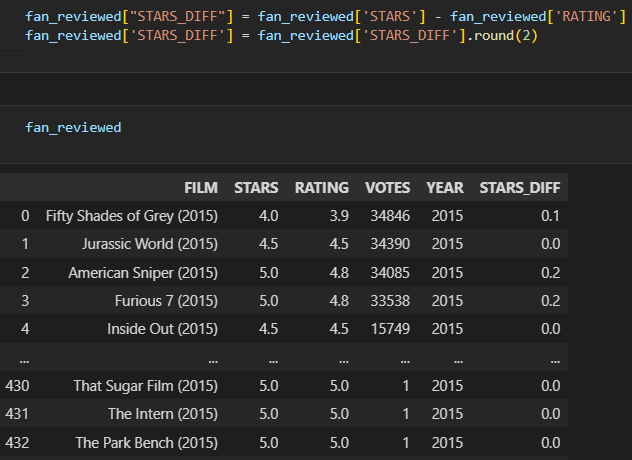
Quantified this discrepancy by creating a new column of the difference between STARS displayed Versus true RATING
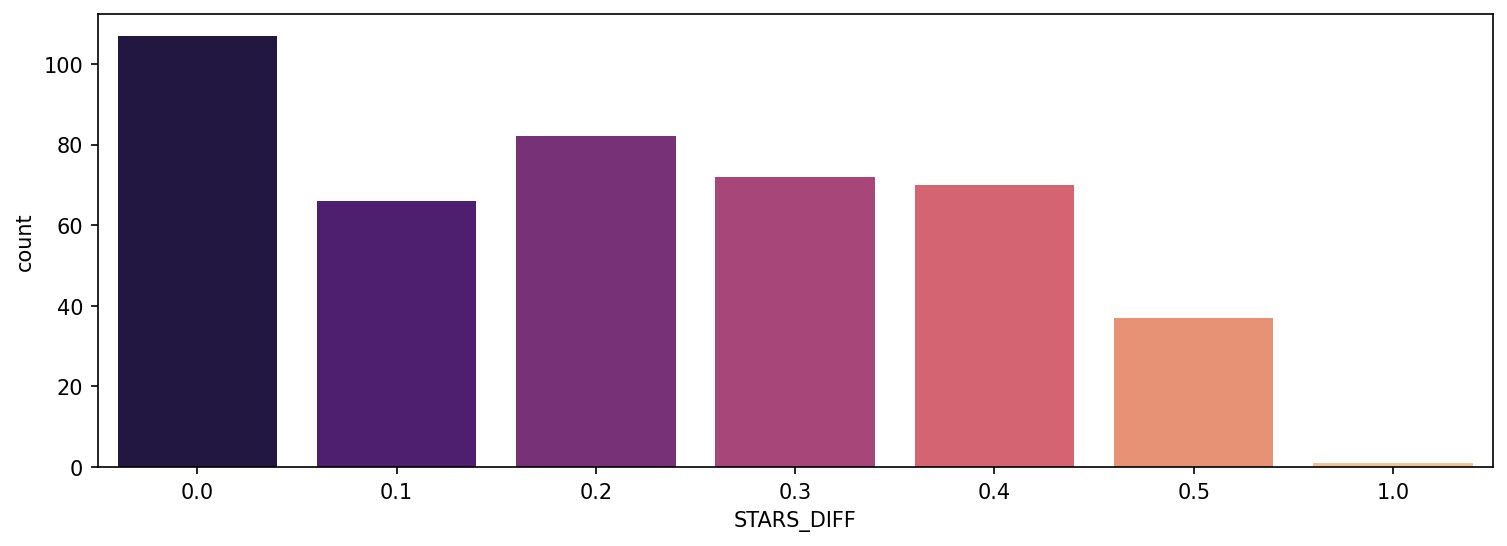
● We can see from the plot that one movie was displaying over a 1-star difference that it’s true rating!
![]()
Time To Compare Fandango Ratings with Other Sites

Difference by comparing the critics rating & the RT rating
Plotting the distribution of the differences between RT Critics Score and RT User Score. (using KDE and Histograms to display this distribution.)
● So, comparing the overall mean difference. Since we’re dealing with differences that could be negative or positive, first take the absolute value of all the differences, then take the mean. This would report back on average to the absolute difference between the critics rating versus the user rating.
● all_sites[‘Rotten_Diff’].apply(abs).mean() = 15.095890410958905
all_sites[‘Rotten_Diff’] = all_sites[‘RottenTomatoes’] – all_sites[‘RottenTomatoes_User’]
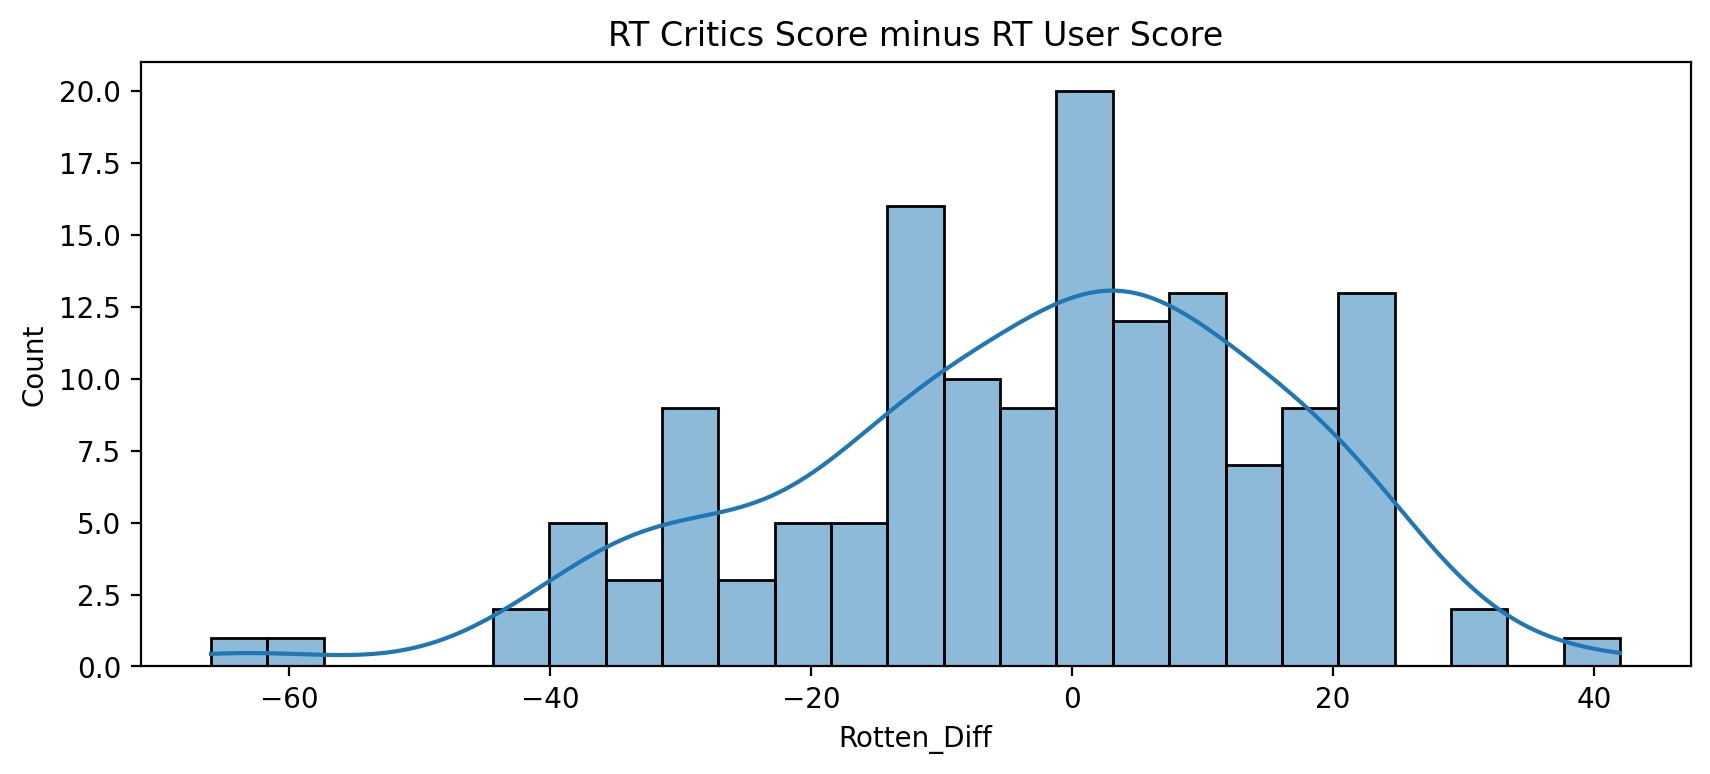
● Larger positive values means critics rated much higher than users. Larger negative values means users rated much higher than critics.
Also, this histogram and KDE plot shows us which movies are causing the largest differences.
1- Top 5 movies users rated higher than critics on average
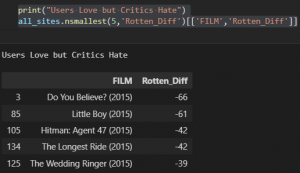
2- Top 5 movies critics scores higher than users on average
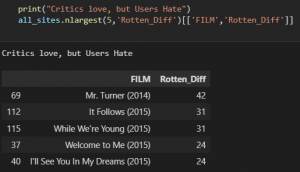
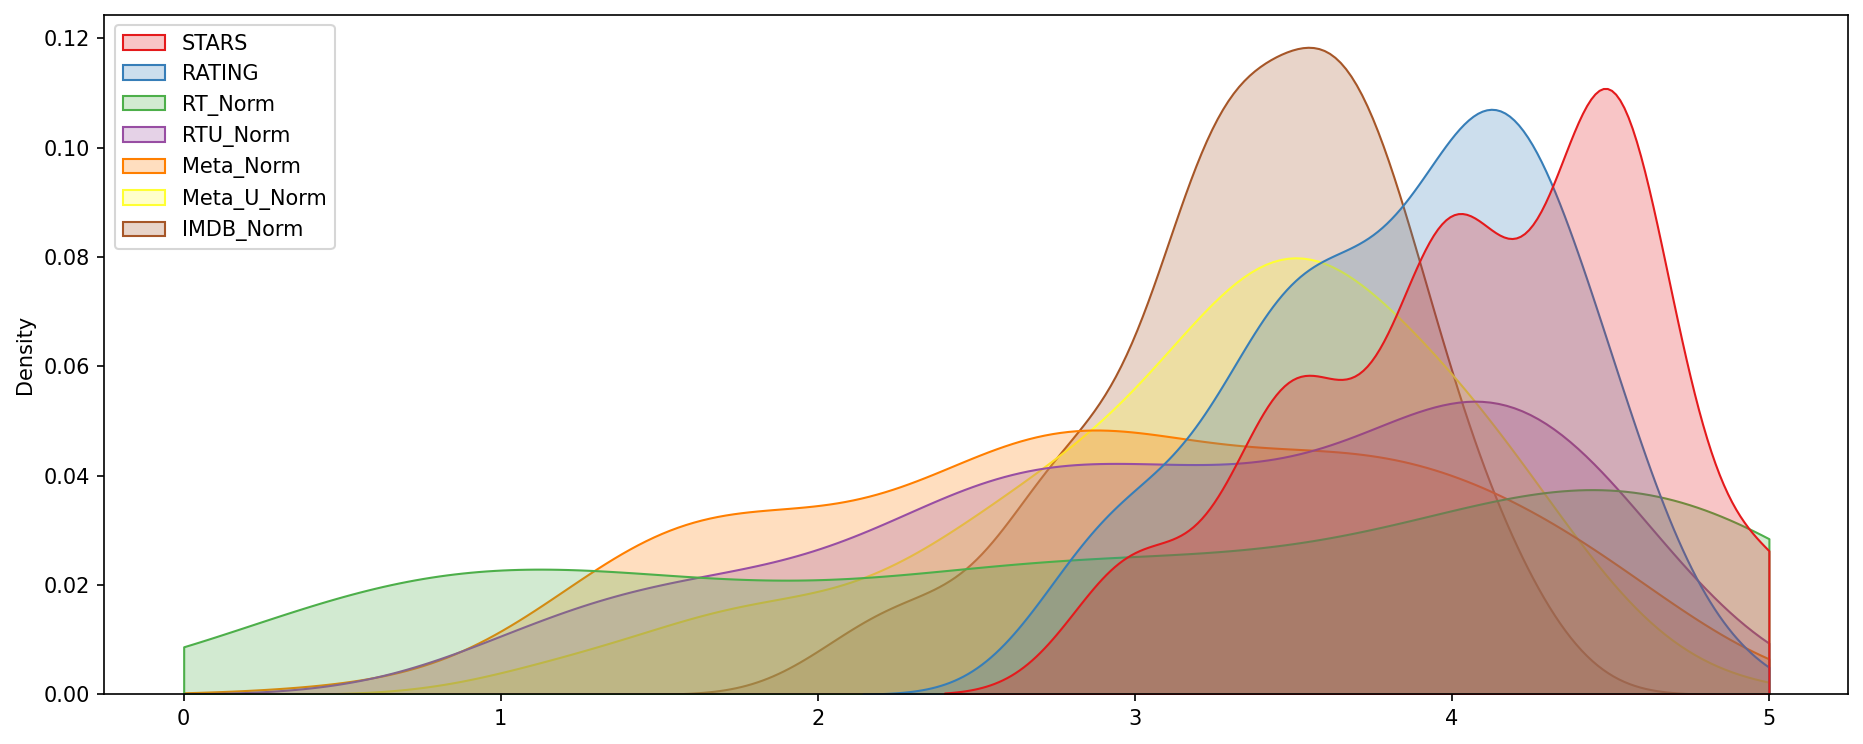
Finally, the truth! Does Fandango artificially display higher ratings than warranted to boost ticket sales?


Finally, A clustermap visualizes all normalized scores. Note the differences in ratings, highly rated movies should be clustered together versus poorly rated movies
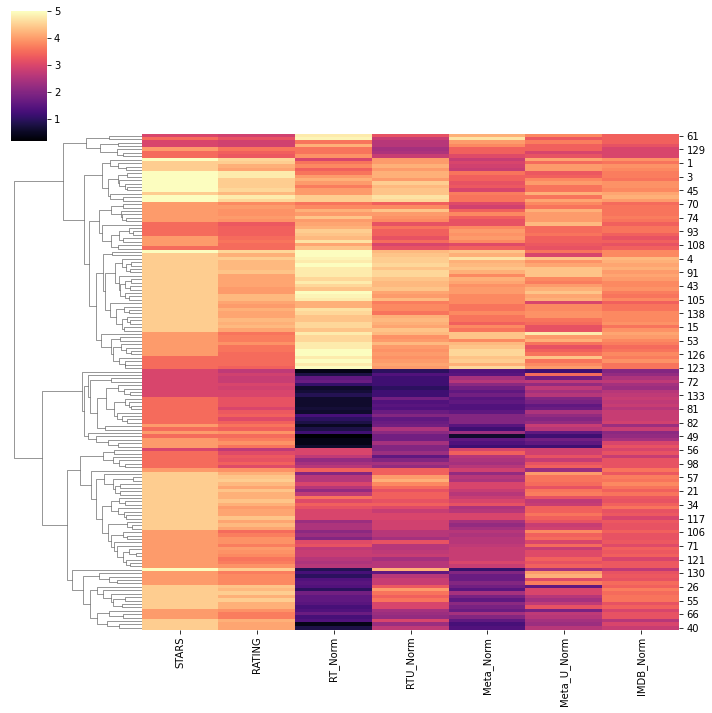
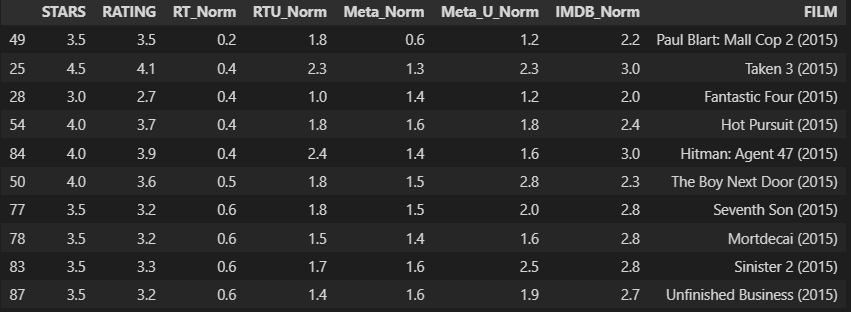
Fandango is showing around 3-4 star ratings for films that are clearly bad!
let us choose one movie


I have trust issues !!!!! 😉