Happiness is a term used to show content or pleasure of the current situation a person is in, whether he has good food, wealth, or health. So to talk about a whole country’s happiness, our study will depend on numerous macroeconomic and socioeconomic factors, which vary by country.
So in this report, we are going to study the happiness score of 153 countries around the world from 2015 until 2021 by analyzing variables like GDP per capita, health, freedom, and government trust and see how these factors play an essential role in shaping the happiness score of the country, in addition to taking some examples of events that have occurred over the past 6 years to analyze them and see how their happiness score varies due to these events.
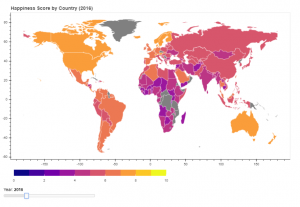
Fig 1: Heat map that show the happiness score by country in 2016
The data used in this study was collected from a Survey from Gallup World. The scores are based on answers to the most life evaluation address inquired within the survey, which asks the participants to think of a step with the most excellent conceivable life for them being a 10 and the most exceedingly bad conceivable life being a 0, and to rate their claimed current lives on that scale
But does only 1 factory have a great influence on the happiness score of the country? To address this question we are going to use power Bi as a visualization to tool to better understand the data Given.
Money doesn’t buy Happiness
Considering a country’s GDP per capita is a great method to evaluate a country’s development and productivity as well as happiness. However, placing too much emphasis on GDP rankings may also be deceptive. In particular, it’s crucial to look at people’s happiness levels rather than using GDP as a stand-in for wellbeing. With higher GDP we can expect that a country has good healthcare, education and production but at the same time these need to be accompanied by a responsible governance from the country which most of the cases this factor can be very volatile.
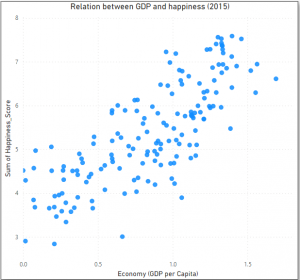
Fig 2: Scatter plot that shows the relationship between the GDP and the happiness score
As we can see from Fig 2 there is no direct model that can we build on the theory that higher GDP is correlated with happiness.
Health equals happiness?
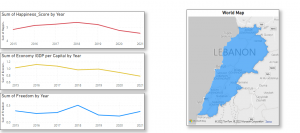
Living within a country that does not provide adequate healthcare services and a healthy environment can have a massive impact on the country well-being. So in the Fig 3.1 and 3.2 we compared the evolution of the happiness score depending the average life expectancy. Also in this scenario we took 2 the continents that have the highest and the lowest happiness score in the list which are Europe and Africa.
In Africa, as we can see we have a positive trend on the happiness score from 2017 till 2021 and it is followed by an increase in the happiness score by 50%. So here there is direct impact on the life expectancy with Happiness. So a small increase in the health indicator is followed by a big increase in the happiness score

Fig 3.1: Bar chart that shows the average happiness and life expectancy in Africa between 2015 and 2021
For Europe, we can observe in fig 3.1 we can notice also that we have have a positive trend in the happiness trend from 2017 to 2021 and is followed by a minor increase in the happiness score.

Fig 3.2: Bar chart that shows the average happiness and life expectancy in Europe between 2015 and 2021
So we can conclude from these illustrations the there is a positive relationship between health and happiness but the percentages changes can vary from continent to content depending on the overall situation of the countries or the continent.
Corrupted Nations, Unhappy People
The impact of corruption on people’s daily life is a less talked about subject than the relation between corruption and the economy. In fact, corruption has a great impact on people’s well-being because governors who runs their countries with bad intent will infect the people that are below them to do the same. In the case when the society is continuously exposed to the corruption, the perception of people of what is right or wrong slightly changes and leads to the decrease in happiness and social progress.
As an example, in 2019 9 countries around the world had eminent revolutions against the corruption that was present. Unfortunately, most of these countries had low happiness ranks.
One of those countries is Lebanon. Since the end of the civil war, corruption have taken control of the nation and had negative impacts around the years which lead to a nationwide revolution that accelerated the financial crisis which was evident to happen.
That lead to a drastic decrease in the GDP per Capita, freedom and others which resulted in the decrease of the happiness rank by 20 ranks.

As we can see from this table the corruption index in Lebanon was increasing drastically during these years and Lebanon corruption rate was always above the regional and the worldwide average.
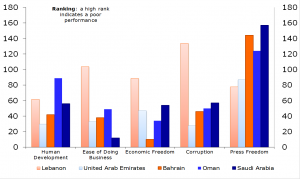
Fig 4: shows the different national indicator for 5 Arab countries in 2013.
As it shows Lebanon had by far the highest corruption indicator between these countries.
Summary
In conclusion, it is clear that some variables directly affect the happiness score while others only somewhat affect this KPI. Overall, though, they all contribute significantly to the nation’s happiness score, and we hope that leaders and governors will take this information into account as they work to improve both their country’s weak aspects and its strong spots.
