- Introduction:
In the relations between countries, there is a disparity in the financial capabilities between them. Some of them for example, have greater financial capabilities than others that enable them to help countries that need money in certain cases, to carry out certain projects, and in emergencies.
Lebanon is one of the countries that does not have enough financial capabilities to dispense with the assistance of other countries to it. Therefore, several funding from various countries arrives annually in Lebanon.
Is the rate of funding for Lebanon high in the past four years? What is affected?
Using the Dataiku dashboard, and a dataset collated by OCHA’s Financial Tracking Service, we will answer these questions by sharing some data visualization on incoming funding in Lebanon in the past four years.
- Dashboard overview:
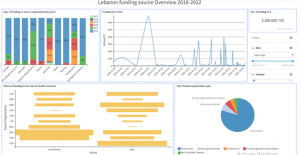
The first slide of the dashboard contains a title, 4 charts, 1 metric, and a filter.
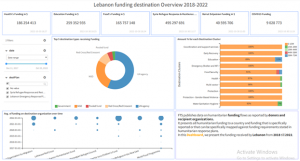
The second slide of the dashboard contains a title, 3 charts, 6 metrics, a text description, and a filter.
- Interpretation:
- Slide 1:

This stacked bar chart presents the Avg. of funding for source organizations in the last 4 years (2018 – 2022). We can see the variation in avg. of funding in each country. For example, Canada provided more funding in 2022 compared to other years, while Germany provided more funding in 2019 than it provided in other years. This indicates that incoming funding is affected by the donor countries’ view of Lebanon’s financial situation and their assessment of whether it needs donations or not.

This Line chart shows the variation in the Avg. of incoming funding over the last 4 years. We can note that the rate of incoming funding was at its peak in 2019. It is worth noting that this year the revolution erupted in Lebanon, which led to economic collapse and difficult economic conditions. After that, we see a significant drop in the rate of funding.

This chart presents the Status of funding in the top 10 funded countries. We can see the top 10 countries that give Lebanon funding are: USA – SWE – NOR – JPN – FRA – FIN – DNK – DEU – CHE – CAN. In funding, there are two types: Commitment and Paid. We can notice that Canada pays always. As for DNK’s funding, it is a commitment more than a payment.
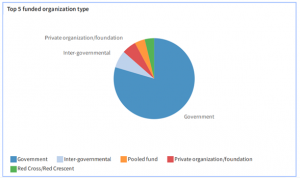
This pie chart shows the top 5 from the different types of source organization that gives Lebanon funding. The Government type is the most given funding, and it’s normal. The other 4 types are Inter-governmental, Pooled fund, Private organization/foundation, and Red Cross/ Red Crescent.

In this metric, we can see the rate of the total funding in $ in the last 4 years.

The dynamic part of this slide is these 2 filters. The first filter is on the date range, so we can choose the date range that we want and the results on the charts will change based on this date. The second one is about the method of payment if it’s traditional aid or Cash transfer payment CTP.
- Slide 2:
The incoming funding in Lebanon is divided between several sectors and cases. In the following metrics, we will see the total incoming funding for every sector.
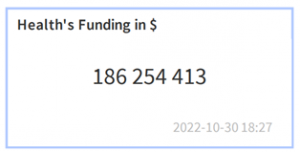
This metric shows the total incoming funding in the Health sector.
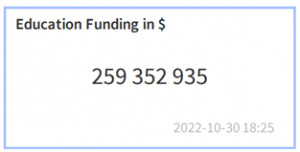
This metric shows the total incoming funding in the Education sector.
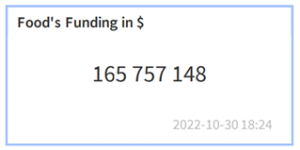
This metric shows the total incoming funding in the Food sector.
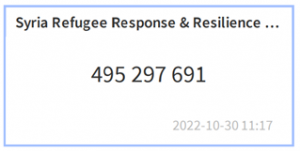
This metric shows the total incoming funding in Syria Refugee Response & Resilience case.
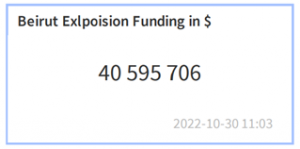
This metric shows the total incoming funding in the Beirut Explosion case.
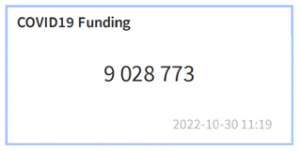
This metric shows the total incoming funding in COVID-19 cases.
We can notice from these metrics, that the Syrian refugee response and resilience plan has a higher rate of incoming funding due to a large number of Syrian refugees in Lebanon, and because it is an issue agreed upon by more than one country, financial assistance for this case is provided by several countries and in large amounts. Also, in the Beirut explosion case, Lebanon receives a high amount of funding.

This donut chart shows the top 5 destination types that receive funding in Lebanon from other countries. The top 1 is the UN agency and it’s a normal result because the UN agency receives funding from various countries. After all, it is one of the top international organizations concerned with helping countries that need help. The other types are Government, NGO, Pooled funds, and Red Cross/ Red Crescent.
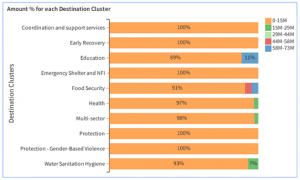
This stacked bar chart shows the Amount % for each Destination Cluster. We can see that 95% of the funding is less than 15M $. And most sectors are not funded by more than 15M as the chart shows. But there is multi sectors like education and Food security that received in some case, with a small percentage, funding greater than 15M $.
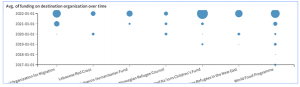
This bubble chart contains the variation of Avg. of Funding for destination organizations over time. For example, the Lebanese Red Cross start receiving in 2020 (this year COVID-19 appeared in Lebanon), but the world food program received till 2018.

It’s a tile containing text that describes briefly our topic.
- Conclusion:
As we have seen in above, the rate of incoming funding granted to Lebanon is affected by the current conditions in the country like the Beirut explosion, and COVID-19, and the most one is the Syrian refugee response & resilience plan.
And the most helpful countries to Lebanon are: USA – SWE – NOR – JPN – FRA – FIN – DNK – DEU – CHE – CAN.
We conclude also, that not a year has passed in the past four years, without Lebanon receiving funding from abroad. This indicates his difficult economic situation.
- References:
Dataset: https://data.humdata.org/dataset/fts-requirements-and-funding-data-for-lebanon

Great article!
I didn’t like the type of charts used in this analysis.
The article effectively highlights the impact of Lebanon’s current conditions and international aid on its funding situation, shedding light on the country’s ongoing economic struggles and the significant role played by key supporting nations. It was a very interesting read!