Introduction:
Supply chain operations are the lifeblood of any successful business, orchestrating the flow of goods and services. They connect raw materials to end products, ensuring seamless delivery to customers. The key to mastering this intricate dance lies in the data. It’s not just numbers; it’s the vital insights they hold. Welcome to the Data Smart Supply blog, where we understand the importance of supply chain operations and the power of data-driven insights. Let’s embark on a journey to unlock your supply chain’s full potential and make every link in the chain count towards your organization’s success.

We’ll introduce two informative dashboards, each highlighting distinct aspects: sales, delivery, and an ABC analysis.
Sales Analysis:
Let’s dive into the sales dashboard, where we’ll dissect the numbers, uncover trends, and gain invaluable insights into this critical aspect of the supply chain.
Interpretation:
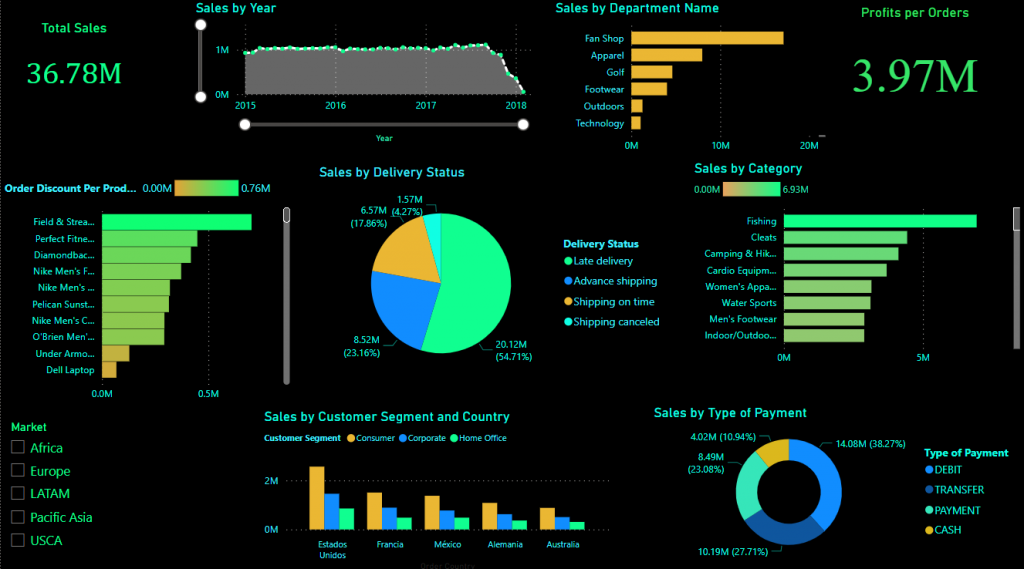
Total Sales: The total sales figure of $36.78 million showcased in the dashboard highlights the extensive scope of our supply chain operations. To continue this success, we should explore ways to sustain and potentially increase this revenue.
Sales Trends: Over the years, our sales remained relatively steady in 2015, 2016, and 2017. However, towards the end of 2017, we noticed a decline. To address this decline, we need to investigate the factors that led to this drop and make data-driven adjustments.
Sales by Department: The Fan Shop department emerges as a star performer, contributing significantly to our sales. This insight suggests that we should invest in and focus on optimizing the Fan Shop department’s operations to further boost overall sales.
Profits: While our profits amount to $3.97 million, which is a respectable 10% of total sales, there is room for improvement. It’s crucial to explore strategies that can enhance profitability, such as cost-cutting measures or pricing adjustments to increase the profit margin.
Order Discounts: The fact that Field and Streams products received the most discounts indicates that there might be opportunities to fine-tune pricing strategies. We should assess the impact of discounts on our overall profitability and consider whether they are driving the desired results.
Late Deliveries: It reveals a concerning issue with late deliveries, as 54.71% of orders fell into this category. This is a critical area that needs immediate attention. Improving delivery performance is vital for customer satisfaction and retention. We must streamline our delivery processes and possibly invest in better logistics to reduce late deliveries.
Market Segmentation: Offering various market choices like Europe and Asia to make the dashboard interactive is a smart move. We can adapt our strategies to the different markets, considering local preferences and demand. This approach allows for better market penetration and customer satisfaction.
Customer Segments: Consumer emerges as the primary contributor to sales. By focusing on this segment, we can develop tailored marketing and customer service strategies to further enhance sales within this group. The top 5 countries with the highest sales should be closely monitored and studied for insights into what’s driving their purchasing behavior.
Payment Methods: Analyzing the preferred payment methods, with Debit and Transfer being favored over Cash and Payment, provides insights into customer behavior. We can fine-tune our financial strategies to encourage the use of these preferred payment methods, potentially saving costs and improving cash flow.
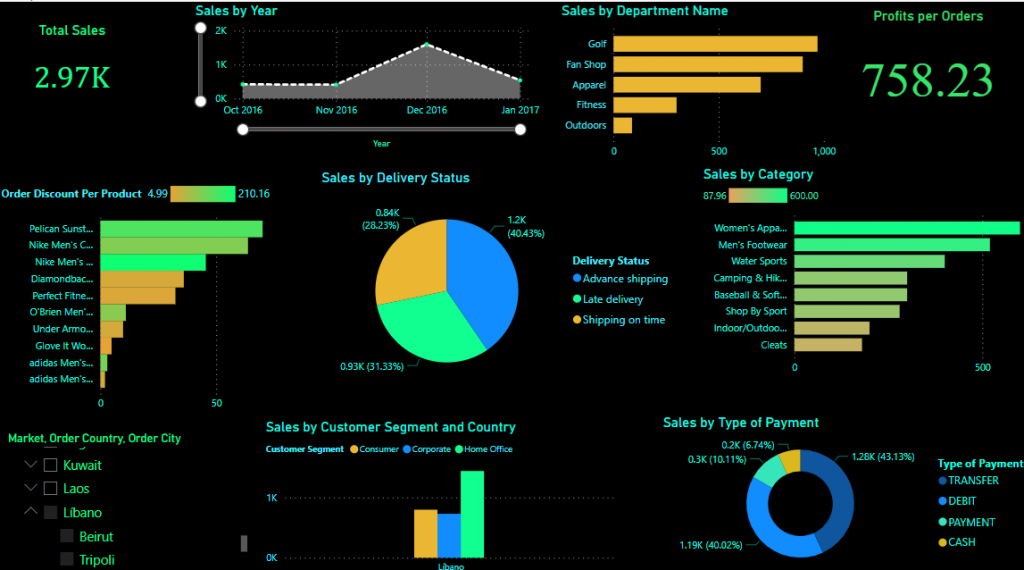
As our dashboard offers interactivity, let’s narrow down our focus and filter sales data specifically for Beirut, Lebanon.
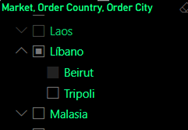
Let’s take an overview on our new dashboard:
Let’s choose some graphs to visualize:
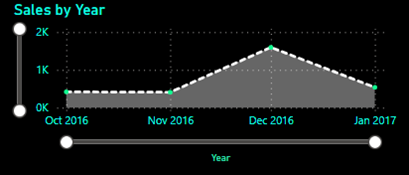
Observing the sales trends in Beirut, it’s evident that they show a recurring pattern, with a peak usually occurring in December. This pattern suggests a clear seasonality, which could likely be attributed to the holiday season, particularly Christmas.
Another plot below shows :
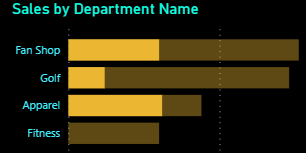
When narrowing our focus to late deliveries, it becomes apparent that only three departments in Beirut—Fan Shop, Golf, and Apparel—experienced late deliveries during the period between 8 AM and 12 PM. This valuable insight prompts us to take targeted actions to improve the delivery process for these specific departments, ensuring a smoother and more punctual service for our valued customers.
As you’ve observed, the flexibility of our dashboard allows you to filter by country, city, or market to uncover valuable insights tailored to your specific needs.
Delivery Analysis:
When it comes to delivery, every customer wants their package delivered on time and in perfect condition. Since we suffered from late deliveries, and as a business owner, you need to ensure that your delivery process is efficient, timely, and reliable. Let’s take a closer look at some insights from the delivery report and understand how they can help improve your business.
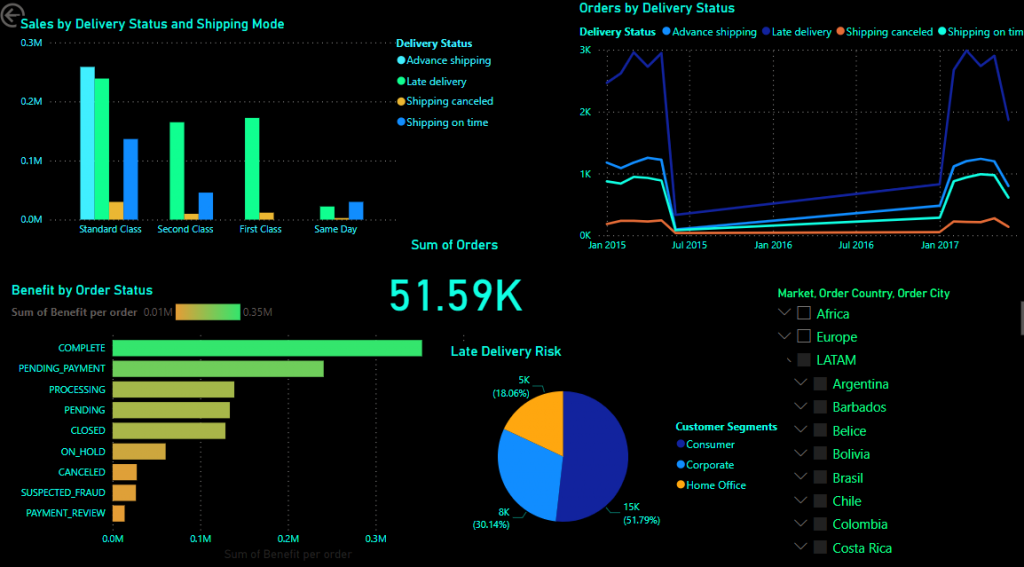
In the first plot:
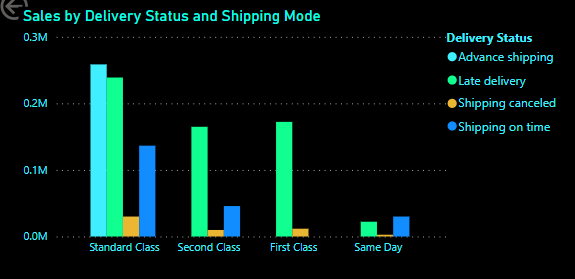
We present a comprehensive view of the delivery status in correlation with the shipping mode. Shipping modes are categorized into first class, second class, standard class and same day class. Upon closer examination, it’s evident that late deliveries are present across all shipping classes, including the premium First Class where customers are investing more for timeliness and reliability. To ensure customer satisfaction and maintain our competitive edge, it’s crucial that we make improvements to address the issue of late deliveries across all shipping classes.
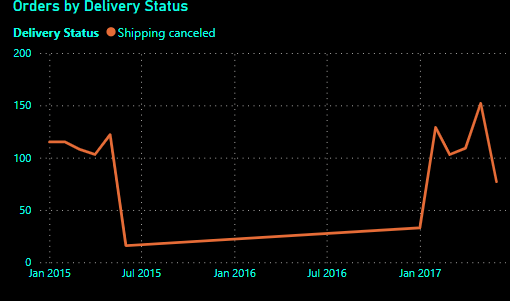
In the second plot:
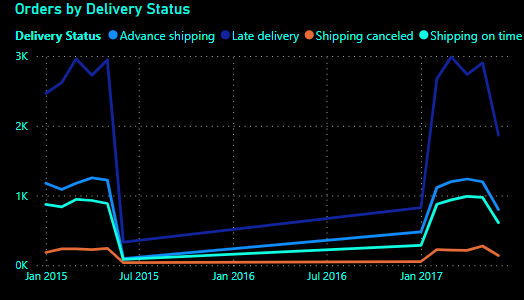
We present a line chart displaying the number of orders for each type of delivery. An intriguing pattern emerges as we examine the data. Over the three-year period from 2015 to 2017, across all four delivery types, there is a consistent and notable increase in the number of orders during the month of January. This recurring trend strongly suggests the presence of seasonality in our delivery demand, as January consistently stands out as the peak period for orders, year after year.
In the third plot, we focus on the relationship between benefits and order status. Notably, when we apply a filter to isolate suspected fraud cases, a striking pattern emerges.
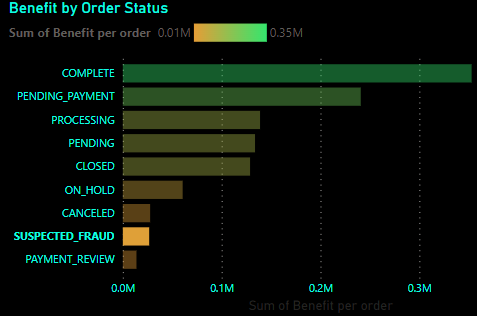
It becomes evident that there were 1,182 instances of detected fraud leading to order cancellations. This insight underlines the significance of our fraud detection mechanisms and their role in safeguarding our business from potentially costly fraudulent activities.
Passing to the fourth plot:
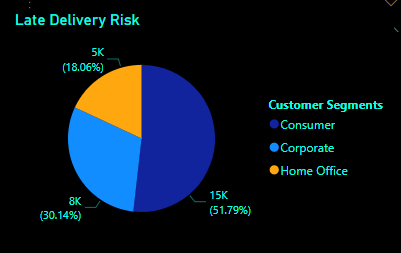
The plot reveals that among our various customer segments, it’s the ‘Consumer’ category that seems to be most affected by late deliveries. This observation underscores the importance of paying special attention to and proactively improving our delivery services for this significant portion of our customer base. By addressing and enhancing the delivery experience for consumers, we can bolster their satisfaction and trust in our services, ultimately contributing to increased customer loyalty and overall business success.
ABC Analysis:
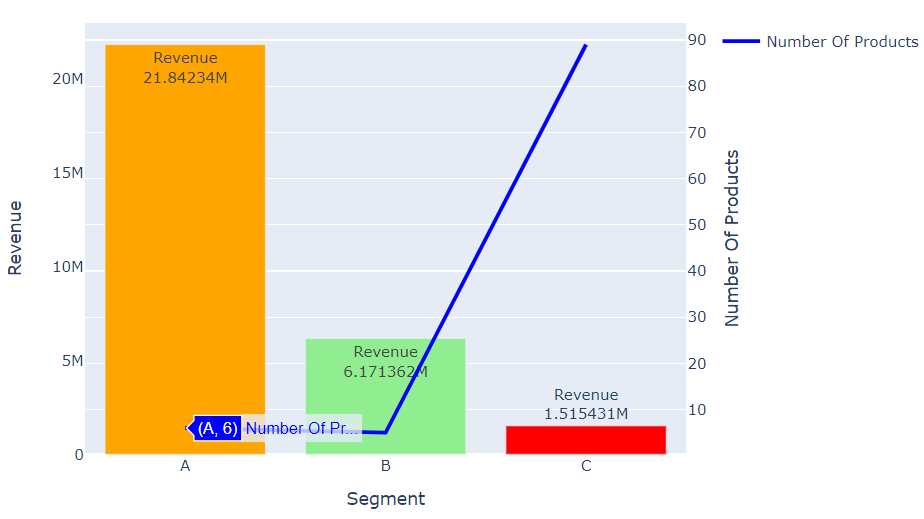
In addition to creating informative dashboards, our analysis included ABC segmentation, a method for categorizing products based on their revenue contribution. ABC analysis is rooted in the Pareto Rule, where approximately 80% of the revenue is generated by only 20% of the products. We classify products into three categories: Class A, Class B, and Class C. This method ensures focused management and prioritization of the most revenue-critical products.
Class A Products (Top 20% of Revenue Generators):
- These are the high-revenue generators, so we must prioritize their availability.
- Maintain a sufficient stock level to prevent stockouts and meet customer demand promptly.
- Implement efficient replenishment and order strategies to ensure these products are consistently in stock.
Class B Products (Next 20% of Revenue Generators):
- While not as critical as Class A, these products still contribute significantly to revenue.
- Maintain a reasonable stock level to meet demand, but not to the extent of Class A products.
- Review and adjust stock levels periodically based on demand fluctuations.
Class C Products (Remaining 60% of Products with Minimal Contribution):
- These products make a marginal contribution to overall revenue.
- Keep minimal stock levels, avoiding overstocking that ties up capital.
- Implement a more conservative replenishment strategy, considering the lower demand.
Before we delve into visualizing the importance of our Class A products in different cities, we’ve taken the initial step of identifying the top six revenue-generating products within this category. This focused approach enables us to effectively showcase the significance of these key products across various city markets.
Applying the ABC analysis on the cities:
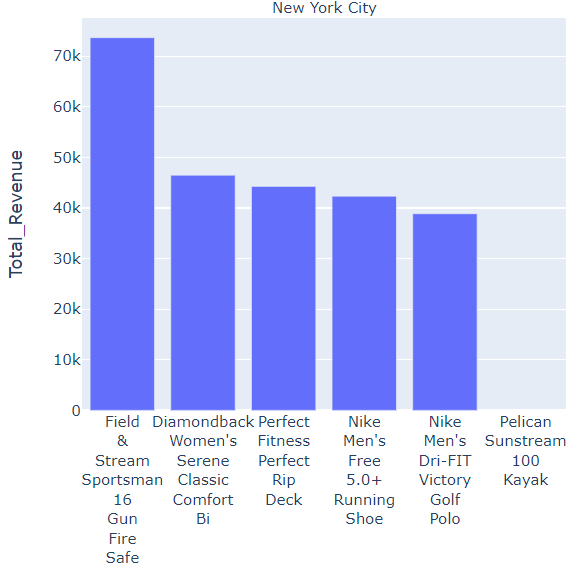
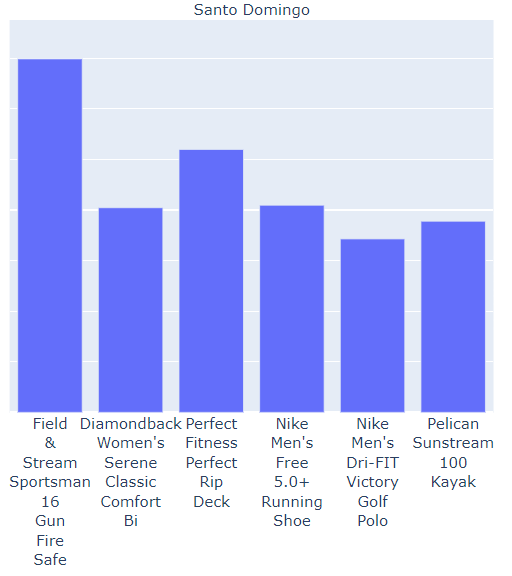
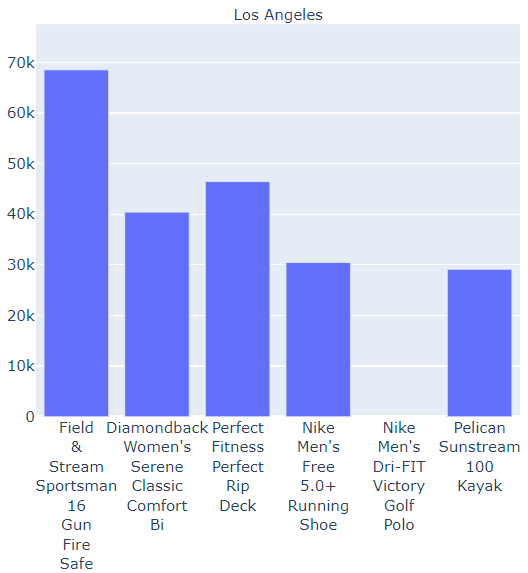
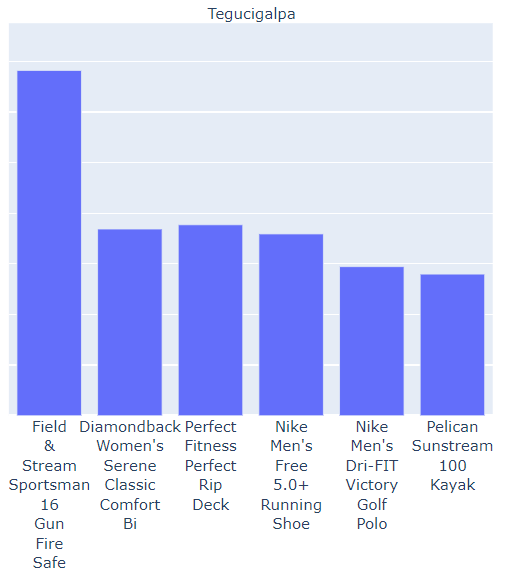
It’s worth highlighting that the classification of Class A products can vary from one city to another. For instance, in New York, the Pelican Sunstream 100 Kayak may not fall into the Class A category, while in Los Angeles, the Nike Men Dri-Fit Victory Golf Polo might not be classified as a Class A product. This distinction allows us to adopt a more cost-effective and space-efficient approach when managing inventory for these cities, directing our resources more strategically toward products that better resonate with local preferences and demand.
Conclusion:

In conclusion, the significance of our supply chain analysis cannot be overstated. Through the interactive dashboards, we gain invaluable insights into our sales, delivery operations, and product categorization using ABC analysis.
The sales dashboard provides a dynamic window into our revenue streams, allowing us to discern patterns, spot opportunities, and make informed decisions. This data-driven approach is essential for staying competitive in today’s dynamic markets.
On the delivery front, our dashboard empowers us to optimize our operations and enhance customer satisfaction. By identifying and addressing issues like late deliveries, we not only improve the customer experience but also boost our operational efficiency.
The ABC analysis, on the other hand, sharpens our inventory management. It guides us in channeling our resources where they matter most, ensuring we are well-prepared to meet customer demand, minimize stockouts, and maximize profitability.
These three pillars – sales analysis, delivery optimization, and ABC product categorization – collectively strengthen our supply chain, enabling us to adapt to market shifts, fulfill customer needs, and thrive in a competitive landscape. The data-driven approach exemplified in our dashboards is pivotal for ensuring our supply chain remains agile, efficient, and customer-centric.
Thank you!
Data Source: DataCo SMART SUPPLY CHAIN FOR BIG DATA ANALYSIS (kaggle.com)

I just had the opportunity to review your blog on supply chain data visualization, and I must say it’s quite impressive! Your analysis and visualizations are meticulously executed, and it’s evident that you’ve invested a substantial amount of effort into ensuring the data is presented with clarity. As a fellow data scientist, I can totally relate to your passion for digging into the numbers and finding those hidden gems. Keep up the excellent work, and I’m eagerly looking forward to witnessing more of your data-driven adventures!