Introduction:
Decades ago, the military expenditure topic was considered one of the vital issues worldwide, not only for its political aspects but also for the economical and humanitarian ones. One of the most active organizations concerned with tracking military expenditure in countries and regions through official and non-official sources is Stockholm International Peace Research Institute (SPIRI) [1] which offers a massive database about how much money is spent on weapons gathering and developing and many other crucial attributes. And for the purpose of this article military expenditures of countries in million dollars, as share of GDP, as share of capita over 10 years (2010-2021) were extracted and visualized in Power BI dashboards [2] to capture their variations.
Countries Spending in Million Dollars:
In the Funnel in figure 1 the countries are sorted by their military expenditure in 2020, we can notice that The United States of America is the most country spending on military issues in a total of 778397 K million dollars (778397 billion), while China ranked second by spending 257.97 K million dollars, in a huge drop compared to USA (33.14 % of the USA spending) while India was in the third rank by spending 79.94 K million dollars (9.37 % of the USA spending).

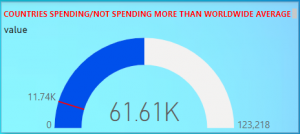
Moreover, one important visual that can be demonstrated by the data is the Gauge visual, it was used to show where if the countries spent above or below the world average and by how much. For example, figure 2 shows Russia case in 2018, where we can see that it spent 61.61 K million dollars, a much above the world average (red line), which is 11.74 K million dollars.

Countries Spending Per Capita:
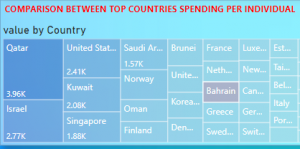
Another analyzed aspect of the data was the spending per capita, in other words, it is the total military spending divided by the number of citizens, in 2021 the top records are shown in the tree map in figure 3, where the TOP 5 countries in spending are respectively: Qatar (3960$ for each citizen), “Israel enemy state” (2770$ for each citizen), USA (2410$ for each citizen), Kuwait (2080$ for each citizen), and Singapore (1880$ for each citizen).

Based on the above numbers, it is worth noticing that on the other side, there are countries such as Nepal, Sudan, Afghanistan, and Pakistan whose average income per year [3]is below 2000 $ (166$ monthly).
Military Expenditure as a Share of GDP:
One of the attributes published by SPIRI is the military expenditure as a share of the gross domestic product GDP, which reveals how much is the percentage of the money spent on army and weapons from the total GDP of the country.
Figure 4 shows the evolution of the average of the share of GDP of all countries over the period between 2010 and 2021, it shows that the climax of the spending in this period occurred in 2014 as it reached 2.007%, and then it dropped to reach 1.784% in 2018, however, although the average decreased in 2021 compared to that of 2020, but it is probable to increase in the few coming years especially after the war between Ukraine and Russia and the international tensions raised by it.

Conclusion:
In a world full of problems, and suffering from critical risks such as Poverty, Climate Change, Pandemics… Countries and especially the powerful ones are wasting the resources of the planet and billions of dollars by engaging in arms race, causing millions of deaths, injuries, collapsed countries, and military struggles everywhere, to serve their colonial plans and financial goals.
Refernces:
