The National Transportation Safety Board (NTSB) is an independent U.S. government investigative agency responsible for civil transportation accident investigations. NTSB’s website offers the data they have for public use. This article explores a dataset related only to airplanes accidents in the US since they have data for different kinds of aviation means (helicopters, balloons, etc.. ) in the whole world.
The dataset (source: www.Kaggle.com, Link at the end) used for our analysis consists of 21,817 records of airplanes accidents in the US over 35 years (1985-2020). We will examine the dataset and figure out the key insights of it, based on its measures, such as trend over time, phase of flight, the make, purpose of the flight, number of engines, and the geographic distribution of the accidents.
1. Trend of the Accidents
As the line chart below shows, the number of accidents was low and stable from the period between 1985 (5 accidents) until 2000 (13 accidents), an increasing trend with 66% average rate started in 2001 and kept growing until 2011 when it reached the peak with 1,372 accidents investigated. Afterward, the number of accidents tangibly decreased to reach 942 accidents in 2020, which was the lowest since 2011/ For sure, the lockdown imposed by the government because of the Covid-19 pandemic was the reason for that drop.

2. Accidents’ locations
Each point in the map below represents an accident, while the color saturation and the size of each point represent the number of injuries caused by that accident. Clearly, we can notice that two-third of the accidents and of the injuries as well took place in the eastern states, mainly in New York, New Jersey, and Florida, whereas California has a big chunk of the western states’ shares.

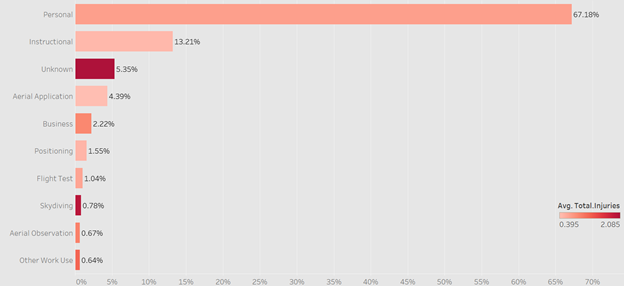
3. Purpose of the flight
In the graph below, we can see the top 10 reported purposes. Personal and instructional form almost 80% of the accidents, and business flights represent less than 3% of the total accidents. Although skydiving flights are no more than 1% of the overall purposes, it has a very high average rate of injuries two persons get injured in every skydiving flight accident.
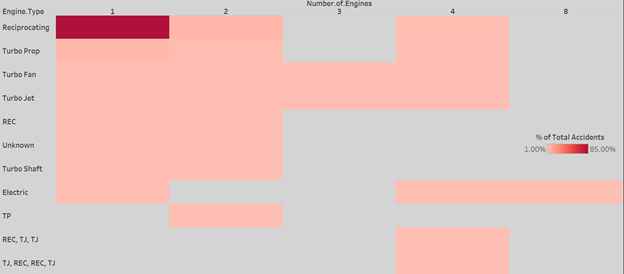
4. Number of engines Vs. type of engines
An intuitive question may come to your mind, is there any correlation between the number or type of the engines with the number of accidents? Let’s find out. Airplanes with 1 engine represent 89% of the total number of accidents, airplanes with 2 engines represent 10%, while all the others represent the remaining 1% of the overall accidents. Regarding the type of engines, reciprocating engines form around 87% of total accidents, while all the other nine types of engines form the remaining 13%. Now, if we put everything together and compare the number of engines against the type of the engines using a heatmap table, we will see that airplanes with single reciprocating engines have the darkest color among all the other types since they represent 85% of the overall number of accidents.
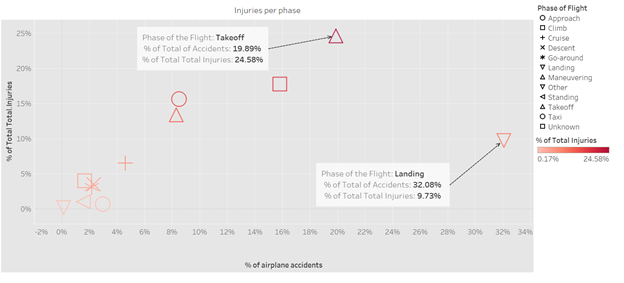
5. Phase of the flight
There is a reason why takeoff and landing are considered the most critical phases of a flight trip. The below scatter plot will explain why… As the graph shows, takeoff and landing are the top two phases in terms of the number of accidents (they both form around 50% of the total number of accidents). However, in terms of injuries, takeoff is the most dangerous phase, with almost 25% of overall injuries.
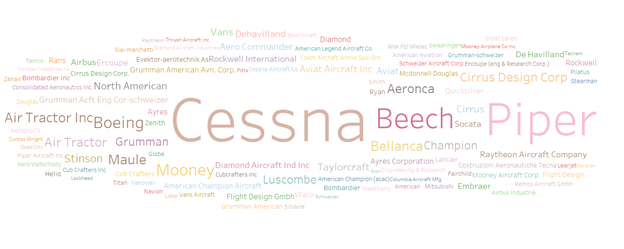
6. Make
Cessna, Piper, and Beech saw around 50% of the total number of accidents, while the other 2,991 make represents the remaining 50%. The common factor across the top three aircraft, that all of them are small airplanes, so they can be used for different purposes (personal, instructional, business, skydiving, etc..) which explains why they have a high accident rate.
Conclusion
Based on the above analysis, we can come up with many observations. But the most important one is this:
If you are planning to go on a skydiving trip soon, somewhere on the eastern coast, try to avoid Cessna one-reciprocating engine airplanes, otherwise, you have to be super careful especially during the takeoff.
Dataset Link: https://www.kaggle.com/khsamaha/aviation-accident-database-synopses
Tableau dashboard link: https://public.tableau.com/app/profile/kazem/viz/airplanecrashes/Thedashboard
