Introduction
Crime is typically at the head of people’s concerns and has an impact on our daily lives. This data will show the influence of crime on life satisfaction, capital income, unemployment, and life expectancy, among other things. This dataset was collected from Kaggle four months ago, in July 2022.
We’ll talk about what might be causing the high crime rate. Is one of them possessing weapons?
Does living in a high-crime country influence one’s capital income, unemployment, happiness, and life expectancy?
We shall learn how these parameters interact with one another and how they affect one’s life.
Crime data:
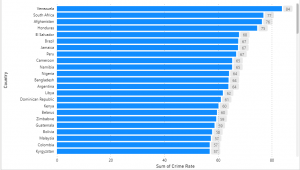
Fig1: High Crime Rate Country.
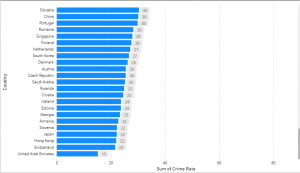
Fig2: Low Crime Rate Country
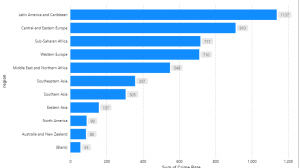
Fig3: Crime Rate by Region
This data shows the countries with the highest and lowest crime rate, but what variables contribute to a country being categorized as safe? The following are the five countries with the highest crime rates: Venezuela, South Africa, Afghanistan, Honduras, and El Salvador. The five safest countries are UAE, Switzerland, Hong Kong, Japan, Slovenia, and Armenia.
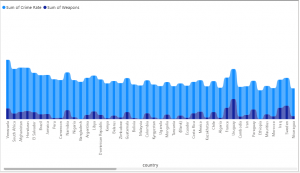


Fig4: Crime Rate Compared to Owning Weapons by Country.
People frequently blame weapons ownership for the country’s high crime rate. This graph will demonstrate whether there is a link between possessing firearms and country safety. The United States has the most weapons (120.5%) and the lowest crime rate (48%), whereas Venezuela has the highest crime rate (84%) and the fewest firearms (18.5%). Let’s analyze the top three countries with the highest and lowest crime rates before rushing to any conclusions.
The countries with the highest crime rates include Venezuela, South Africa, and Afghanistan. These countries’ data are as follows: In Venezuela, 83.7% of criminals possess 18.5 weapons, 76.31% in South Africa own only 9.7% firearms, and 76.31% in Afghanistan own 12.5% of weapons. The UAE has a crime rate of 15.23% and 16.7% weapons, Switzerland has a crime rate of 22% and, shockingly, 27.6% weapons, and Hong Kong has a crime rate of 22 and just 3.6 weapons.
We divided the countries by region because the data were ambiguous.

Fig5: Crime Rate Compared to Owning Weapons by Region.
As we can see, after distributing the data by region, there is no direct distribution between owning weapons and being in a high-crime country. Another question is whether unemployment is the source of rising crime rates in a country.
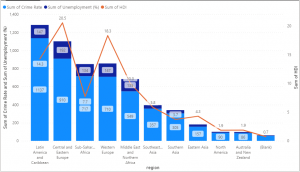
Fig6: Distribution of Crime Rate compared to Unemployment and HDI (Human Life Expectancy)
This distribution implies that there could be a link between unemployment and crime. Without a doubt, the HDI, crime rate, and unemployment have little to no relationship.
Cause of Low Happiness Rate:
How does having a high crime rate affect people’s mental health after examining the causes for it? Here’s a graph that demonstrates if there’s a link between people’s happiness and whether they live in a country with a high or low crime rate, as well as how unemployment affects it.

Fig7: Distribution of Unemployment, Crime Rate, and Happiness by Region.
According to this chart, there is some impact between unemployment on happiness. However, there is no correlation between living in a high or low-crime area and happiness.
Fig8: Tornado Chart Happiness Index*10 and Crime Rate.
Fig9: Tornado Chart Happiness Index and Unemployment Rate.
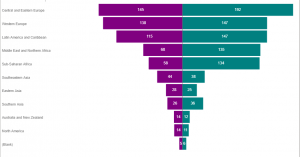
This Tornado chart will explain if there’s any relationship between happiness and crime, happiness and unemployment. The purple color in the first chart represents the happiness index*10, and the green color represents the crime rate of every region. This graph confirms that there is some correlation between crime and happiness. However, the purple color in the second chart represents the happiness index, and the green color represents the unemployment rate by region. This graph illustrates the existence of a correlation between unemployment and happiness.
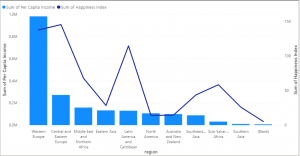
Fig10: Capital Income and Happiness Index.
According to this graph, there may be a correlation between happiness and capital income. Countries located in Latin America and the Caribbean region, with low income, high rates of unemployment, and high rates of crime but with a high rate happiness index, appear strange.
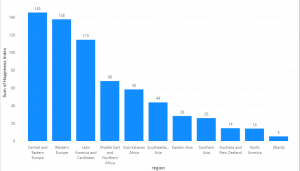
Fig11: Sum of Happiness Index by Region.
This graph represents the happiest region in ascending order. Regions with high unemployment, crime rates, and poor income, such as Latin America and the Caribbean, Sub-Saharan Africa, and the Middle East, appear to have a high happiness index. Finally, there is no direct relationship between those factors.
Cause of Unemployment:
After discussing the causes of crime and happiness it remains only one question to ask, what can be the cause of unemployment?
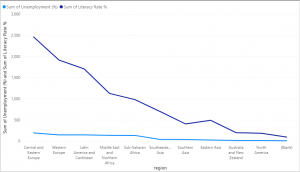
Fig12: Unemployment and Literacy.
This graph demonstrates the relationship between the unemployment rate and the literacy rate. We can conclude that literacy has little effect on unemployment.

Fig13: Line and Stacked Column Chart of Literacy Rate, Unemployment and Capital Income by Region.
This graph demonstrates the relationship between the unemployment rate, the literacy rate, and capital income; we can conclude from this graph that unemployment and literacy have a greater association. However, capital income has a negligible effect on unemployment.
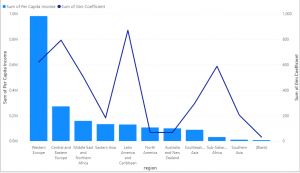
Fig14: Line and Clustered chart of Capital Income and Gini Coefficient.
The relationship between capital income and the Gini coefficient is represented in this graph. This report demonstrates that Central and Eastern Europe, Latin America and the Caribbean, and Sub-Saharan Africa have a high Gini ratio. What appears peculiar is that these countries have a low capital income, a high percentage of unemployment, and a high rate of crime. However, there appears to be no direct relationship between capital income and the Gini index.
Conclusion:
According to this data, we concluded that owning weapons in a country has nearly little influence on safety, and unemployment has a greater impact on life expectancy. Living in a high-income country has little effect on happiness, although places with little capital income, a high percentage of unemployment, and a high rate of crime appear to be happier than others. Literacy, on the other hand, has a stronger impact on unemployment than capital income, whereas literacy has a minimal impact on capital income. Finally, capital income and the Gini index have no direct correlation, and the same strange realization appears here as well: places with low capital income, a high percentage of unemployment, and a high rate of crime not only appear happier but also have a high Gini ratio, which can only be explained by countries with high corruption.
