- Introduction
In the dynamic world of cryptocurrencies, understanding the complex intricacies of Bitcoin’s market performance is crucial for informed decision-making. Through a meticulous analysis using Power BI, and a dataset about historical price of bitcoin, our comprehensive exploration into Bitcoin’s trends provides valuable insights into its price fluctuations, volume dynamics, and predictive trends. Let’s delve into the nuanced exploration of Bitcoin’s journey, deciphering the interplay between real-world events, market sentiments, and predictive models, aiming to uncover the underlying patterns that shape this volatile digital asset.
Our Power BI dashboard is thoughtfully composed of four intricately designed pages, each serving a distinct purpose in unraveling the story of Bitcoin’s market behavior. The first page offers a comprehensive Bitcoin overview, providing a holistic snapshot of its historical performance and key statistical indicators. The second page is dedicated to dissecting Bitcoin’s trend, allowing for an in-depth analysis of its price movements over time. On the third page, a detailed candlestick chart meticulously visualizes the intricate nuances of Bitcoin’s price fluctuations, offering a comprehensive understanding of its volatility and market dynamics. Lastly, our fourth page is dedicated to the crucial aspect of price forecasting, integrating advanced modeling techniques to predict potential trends in Bitcoin’s value. Together, these four pages form a comprehensive narrative, shedding light on the intricate patterns that define the dynamic landscape of this digital asset.
- Bitcoin overview
Our Price Overview page encapsulates key insights into Bitcoin’s performance over time. The ‘Sum of Volume by Month’ KPI reveals a notable peak in October 2021, reaching an impressive 1,565,559 bitcoin. In the same month, Bitcoin’s value surged to a record high of $67,000, while also hitting a minimum of $18,300.
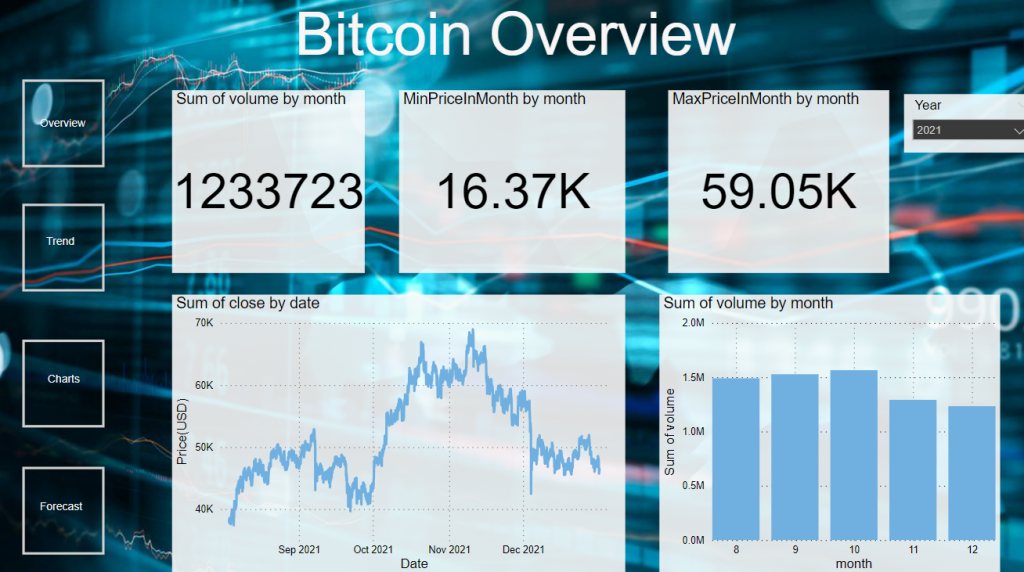
Figure 1: Bicoin price Overview
The dynamic ‘Sum of Close by date’ line chart vividly illustrates the price trajectory, showcasing a climb from around $44,000 at the beginning of the month to a peak of $67,000 on 20th October 2021. In addition, we can see also from the bar chart representing the ‘Sum of volume by month’ that the 10th month of 2021 has the highest volume of bitcoin.
- Bitcoin Trend
On our Trend Detection page, we meticulously explored the intricacies of Bitcoin’s daily price and volume fluctuations. The data analysis for the year 2021 revealed a standout month, with October emerging as the period with the highest trading volume. Upon applying filters by year and subsequently by month, particularly focusing on October, we discovered a notable approximate 4% daily price change percentage. Remarkably, October 20, 2021, marked a significant peak for Bitcoin, with an average price of $65,000. This surge was triggered by the SEC’s approval of the first US Bitcoin-linked ETF, as documented by Investopedia.
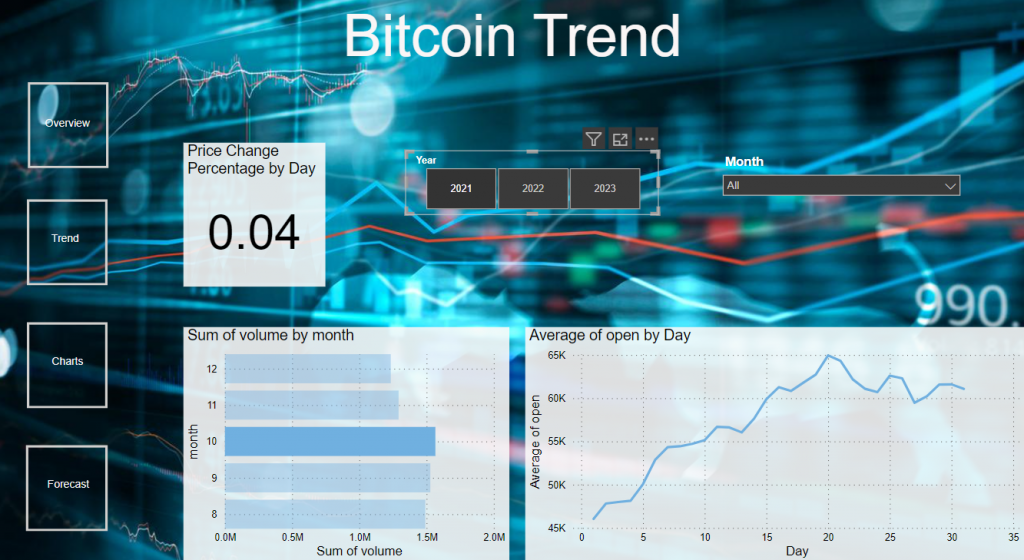
Figure2: Bitcoin Trends for the year 2021
Transitioning to the analysis of 2022, our investigation brought February into the spotlight as the month with the lowest overall volume, as illustrated by the ‘Sum of Volume by Month’ bar chart. Further examination following data filtration for February unveiled a distinct price fluctuation pattern. On February 16, the price hovered at $43,981.30, reaching its peak of $44,314 on February 10, before plunging to $36,119 by the 24th. A closer analysis indicated the influence of geopolitical tension surrounding the Russian and Ukrainian conflict, which surfaced on February 24, leading to a sharp decline in Bitcoin’s valuation. This serves as a striking example of how real-world events can significantly impact the cryptocurrency market, highlighting the interconnected relationship between global affairs and digital asset valuation.
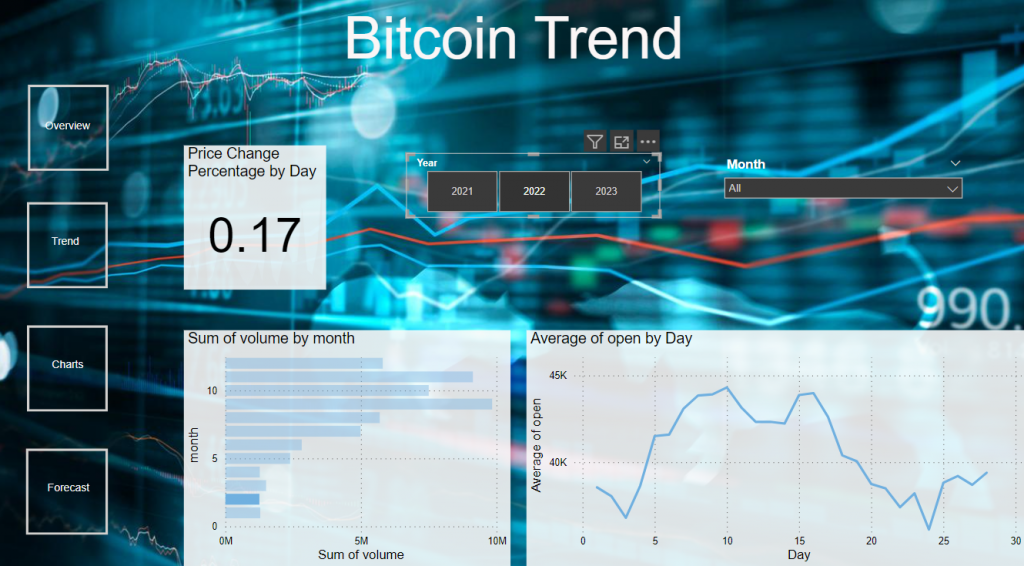
Figure 3: Bitcoin Trend for the year 2022
- Candlestick chart on Bitcoin price
Our focus on dissecting Bitcoin’s intricate price movements led us to the Candlestick Chart page. In this page we will use four candlestick charts, each displaying varying time frames, we closely examined the price dynamics on two pivotal dates, namely, October 10, 2021, and February 24, 2022.
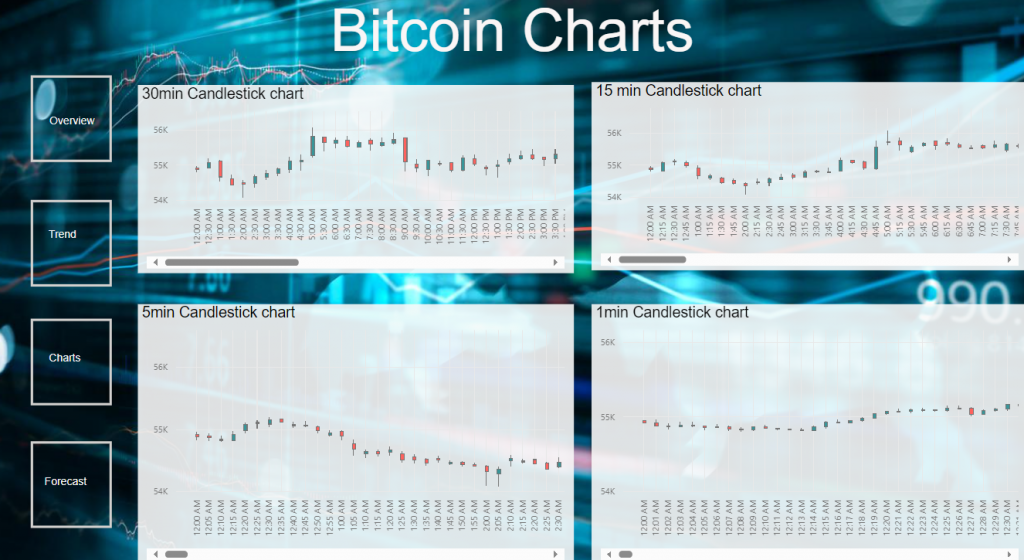
Figure 4: Candlestick chart on bitcoin prices
By strategically employing multiple time frames, we were able to pinpoint precise moments of price fluctuations, discerning crucial insights that guided our trend analysis. Beginning with the higher time frame charts, we traced the overarching price movements and subsequently delved into the finer details by transitioning to lower time frame charts. For instance, the 30-minute candlestick chart illuminated a significant price surge, indicating an attainment of $56,074.43 at 5 AM. Upon inspecting the 15-minute and 5-minute charts, we identified the commencement of this surge at 4:45 AM, with the 1-minute chart pinpointing the exact initiation at 4:43 AM. This meticulous approach underscored the importance of granular analysis in understanding the temporal nuances of Bitcoin’s price fluctuations and market trends.
- Bitcoin price forecasting
Our exploration of forecasting methodologies on the Forecasting page aimed to predict Bitcoin’s future price movements. Employing advanced time series modeling, particularly the ARIMA model implemented in a Python environment, we sought to generate accurate forecasts for Bitcoin’s open and close prices. By juxtaposing the predicted values with the actual price data, represented through two line charts, we assessed the effectiveness of the forecasting model in capturing the underlying trends.
The comparative analysis of the predicted and actual prices over monthly intervals revealed the alignment of general trend directions, although with intermittent disparities where the actual line occasionally deviated from the predicted trajectory. Notably, the forecasting model successfully anticipated both the peak and trough points, demonstrating its potential for identifying critical market junctures.
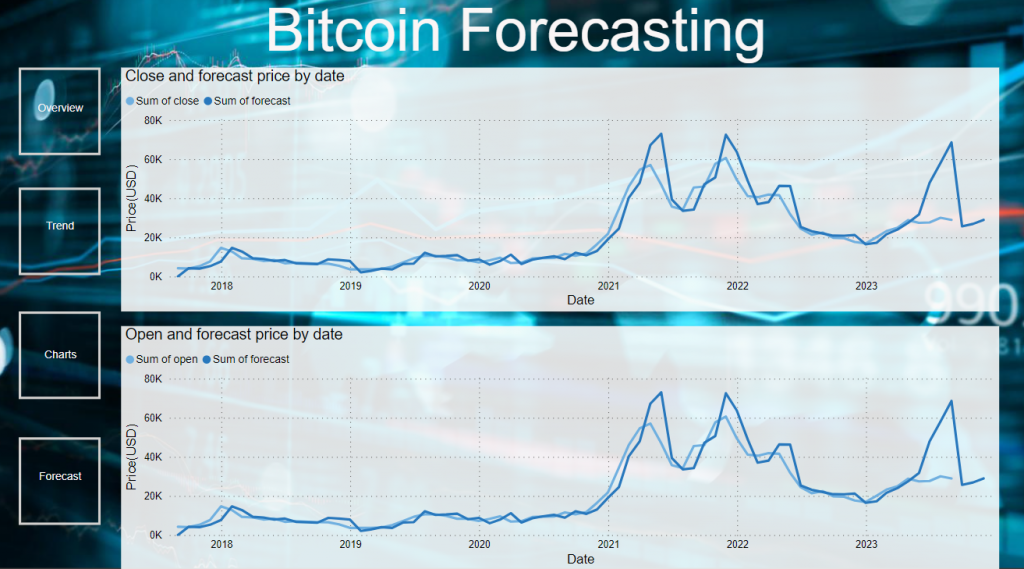
Figure 5: Bitcoin price prediction
However, we encountered challenges associated with significant variations between the actual and predicted price values, emphasizing the need for refining the existing model. To enhance the forecasting accuracy, we propose the integration of alternative modeling approaches, as well as the incorporation of technical indicators, price action techniques, and chart patterns, enabling a more nuanced and comprehensive prediction of Bitcoin’s future price trends.
- Conclusion
Our detailed journey through the world of Bitcoin’s price movements has unearthed crucial insights into the interplay of various market forces and events that influence its trajectory. From the astute observations on price dynamics, volume fluctuations, and trend predictions, it’s evident that the cryptocurrency market is influenced not just by numerical data but also by geopolitical events, regulatory decisions, and investor sentiment. While the ARIMA model served as a valuable tool for forecasting, the significance of refining predictive models with technical indicators and price action techniques cannot be understated. Our exploration underscores the necessity for a multi-faceted approach, combining data analysis, market insights, and advanced modeling techniques, to navigate the dynamic landscape of Bitcoin and anticipate its future trends with greater precision and accuracy.
- Reference
https://www.kaggle.com/datasets/jkraak/bitcoin-price-dataset
https://www.cftc.gov/LearnAndProtect/AdvisoriesAndArticles/BitcoinFuturesETF.html

In the ever-evolving realm of cryptocurrency, understanding Bitcoin’s market performance is paramount, and your blog delivers precisely that. The well-designed dashboard provides a comprehensive overview, in-depth trend analysis, clear visualizations of price fluctuations, and advanced price forecasting. This comprehensive narrative not only sheds light on the intricate patterns that define Bitcoin’s dynamic landscape but also equips readers with the knowledge needed to make informed decisions in the world of cryptocurrency. Great work!
This ‘Bitcoin Trend Analysis’ blog is an outstanding piece of work! I love it! It’s a fantastic job, offering an in-depth exploration of Bitcoin’s market performance using Power BI. The detailed analysis covers price fluctuations, volume dynamics, and predictive trends, shedding light on the interplay between real-world events and the digital asset’s value. A comprehensive breakdown of Bitcoin’s journey with meticulous insights and forecasting, showcasing a multi-faceted approach to navigate the complexities of the cryptocurrency market.