Introduction: In today’s digital age, where travel enthusiasts share their experiences online, a wealth of information can be mined from the feedback they provide. From glowing reviews to constructive criticism, these insights can offer valuable guidance to the hospitality industry in enhancing the visitor experience. In this data-driven analysis, we embark on a journey to explore what truly resonates with travelers based on their reviews and the scores they bestow upon hotels. Our dataset encompasses the voices of visitors from diverse corners of the globe, but our lens is focused on a specific subset – visitors from the Gulf countries. Our aim is to conduct an in-depth analysis of their experiences and preferences, enabling us to provide tailored recommendations to hotels seeking to elevate their offerings and delight their Gulf-based guests.
Objective: Our primary objective is to unravel the preferences and priorities of travelers from the Gulf countries as reflected in their reviews and ratings. By isolating this specific demographic, we can draw distinct insights that hold the potential for targeted improvements in the hospitality sector. Through this analysis, we aspire to offer concrete recommendations to hotels, empowering them to cater to the needs and desires of Gulf visitors, thereby ensuring memorable stays and forging stronger connections with this unique segment of guests. Join us as we embark on a journey to unearth the secrets to guest satisfaction and provide actionable insights for the ever-evolving world of hospitality.
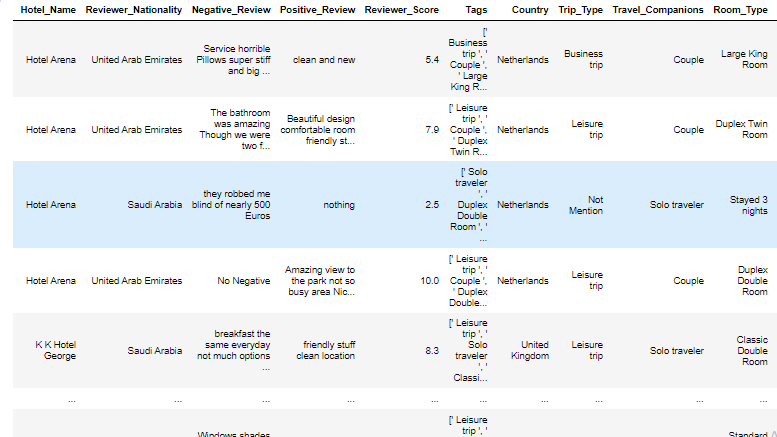
Data Exploration
That’s our data for this project we will focus on those columns to do the analysis.
Exploratory Data Analysis
We will begin with some exploratory data analysis (EDA), during which we will determine the top destinations preferred by Gulf citizens for travel and examine the average rating they assign to each country.
Exploring the Country column
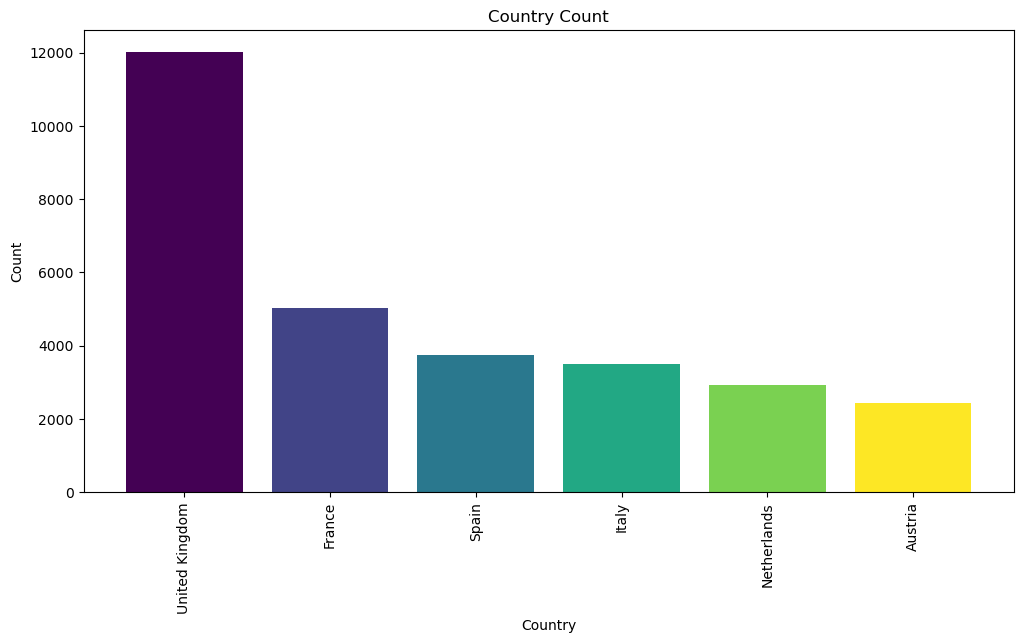
As we can observe from these plots, the majority of visitors choose the UK as their destination, while Austria receives the least number of visitors.
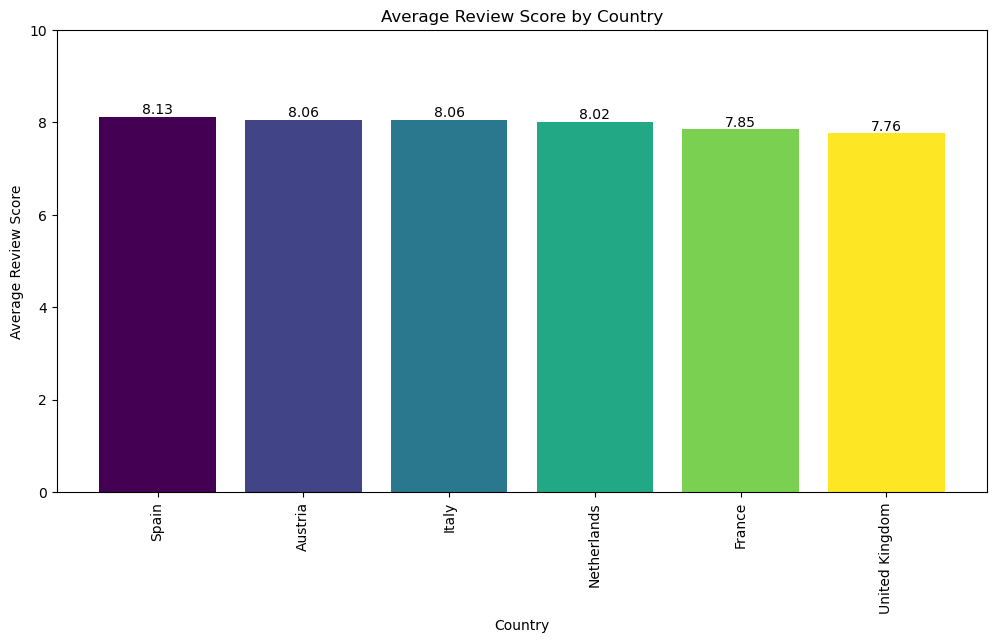
The average ratings are high for all countries, but the UK has the lowest reviewer score.
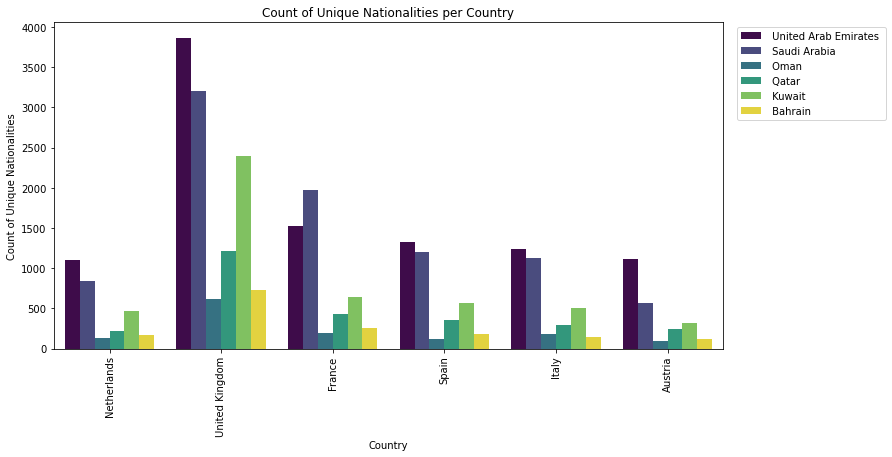
Visitors from the UAE constitute the largest group traveling to the Netherlands, the UK, Spain, Italy, and Austria. The exception is France, where the majority of visitors come from Saudi Arabia.
The average reviewer score in this dataset is 7.9, so i created a new column « Above_average » to check the percentage of hotels per country that have a rating above average.
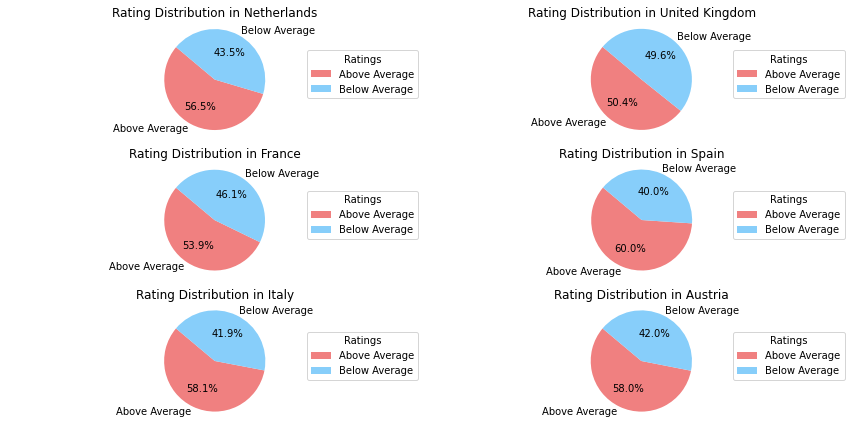
Most of the countries have more above average rating than below average rating except for the UK where almost half of the hotels in the United Kingdom have a rating below average.
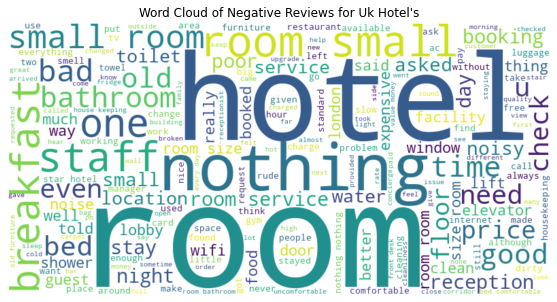
Let’s check the negative reviews that hotels in the UK got, to do this we will use word cloud.
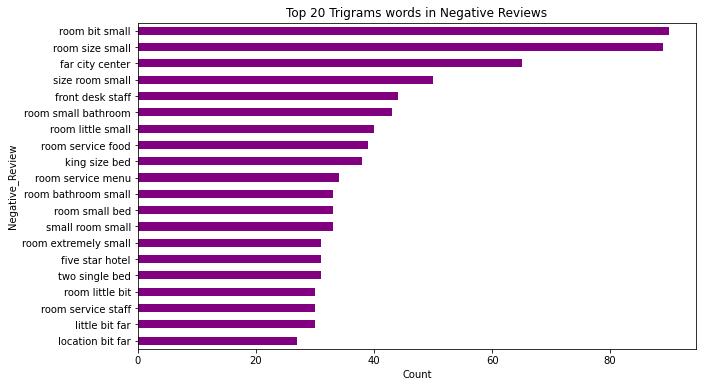
We can also visualize Top 20 trigrams.
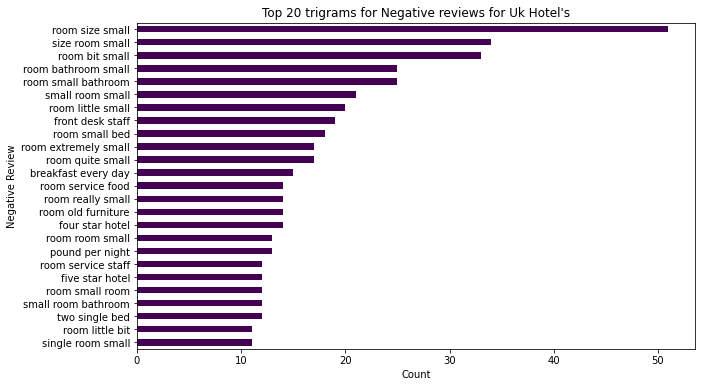
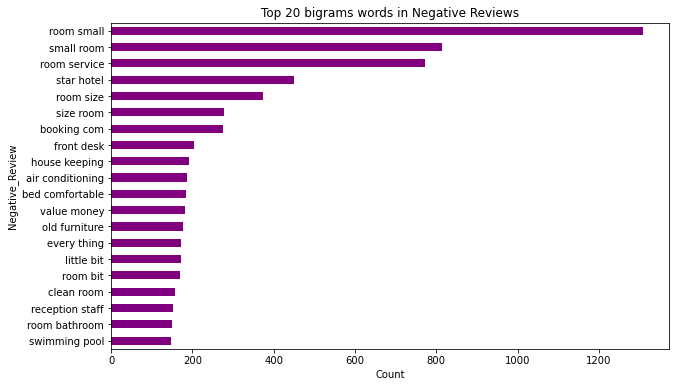
Most of the complaints are from the room as we can see the most common trigrams are related to room:
(small room, room size, room service…) and some complaints are about staff.
Exploring Types of Trips
Now let’s check the Trip_Type column

We have two main categories (Leisure trip and Business trip).
Most of the visitors are going for leisure trip.
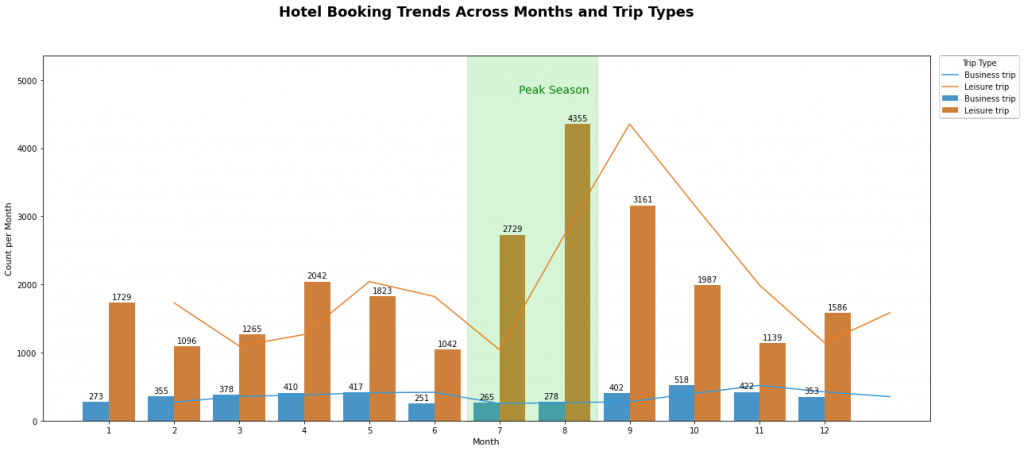
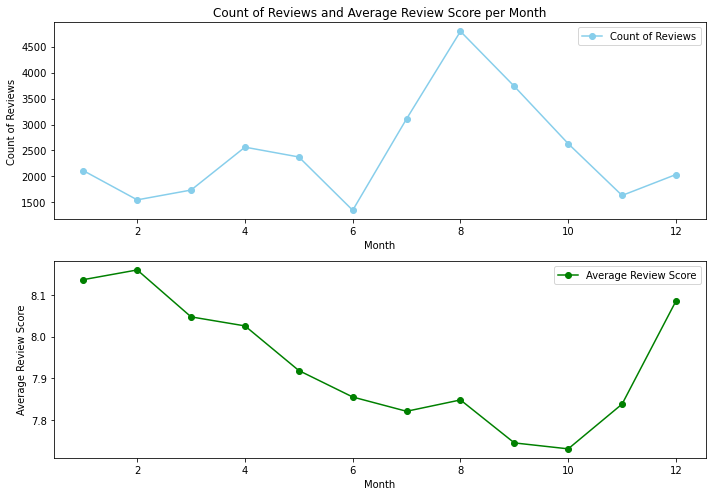
The first plot shows us the numbers of reviews per month as we can see months 7,8,9 have the highest number of reviews since it’s summer season and most of the visitors are on vacation trip.
The second plot shows us the average reviewer score per month, it tend to be a bit lower than average in the summer season probably because there’s a lot of traffic due to this the service is slow or bad.
Let’s check the most common negative reviews for the months 7,8,9.
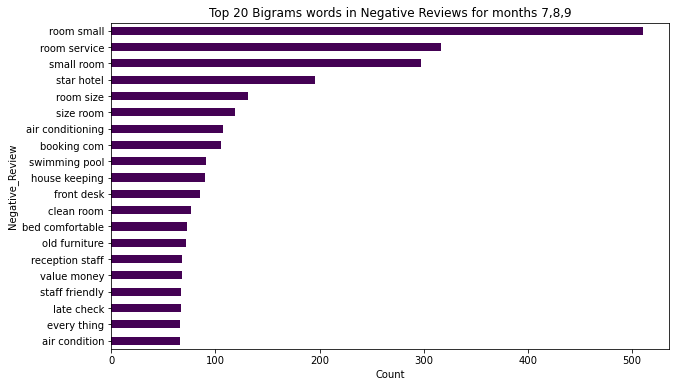
Some of the major problems where the size of the room, the service, and apparently there were some problems with air conditioners.

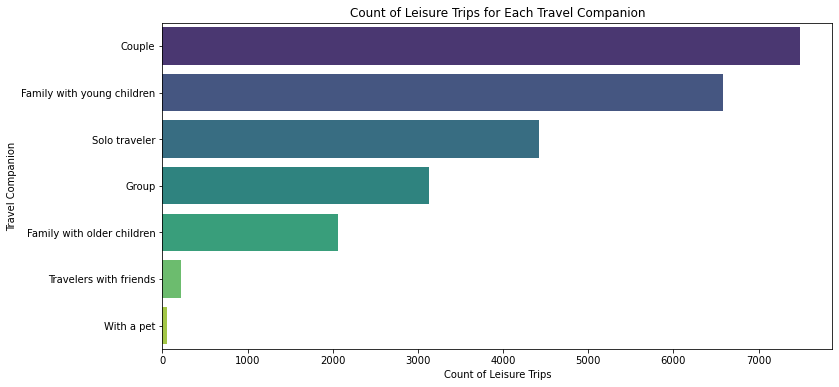
Most of the business trips are taken by solo travelers, while most of the leisure trips are enjoyed by couples.
Now before we go into review analysis let’s take a look at our review metrics.
Analyzing Reviewer Metrics
Those are the review metrics:
Review_Total_Positive_Word_Counts, Review_Total_Negative_Word_Counts, Total_Number_of_Reviews, Total_Words, Pos_Word_Rate, Neg_Word_Rate and Avg_Words_Per_Review
Let’s do some analysis based on them.
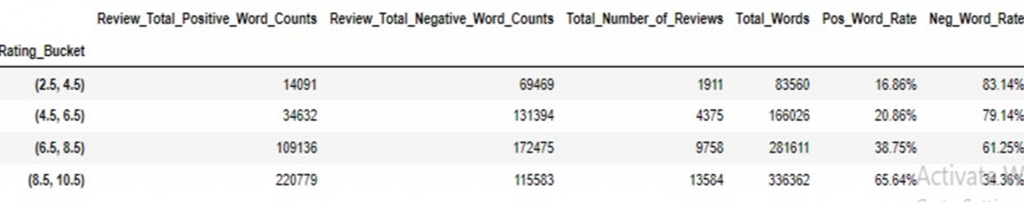
Here we transformed the reviewer rating into 4 buckets : (2.5,4.5), (4.5,6.5), (6.5,8.5), (8.5,10.5)
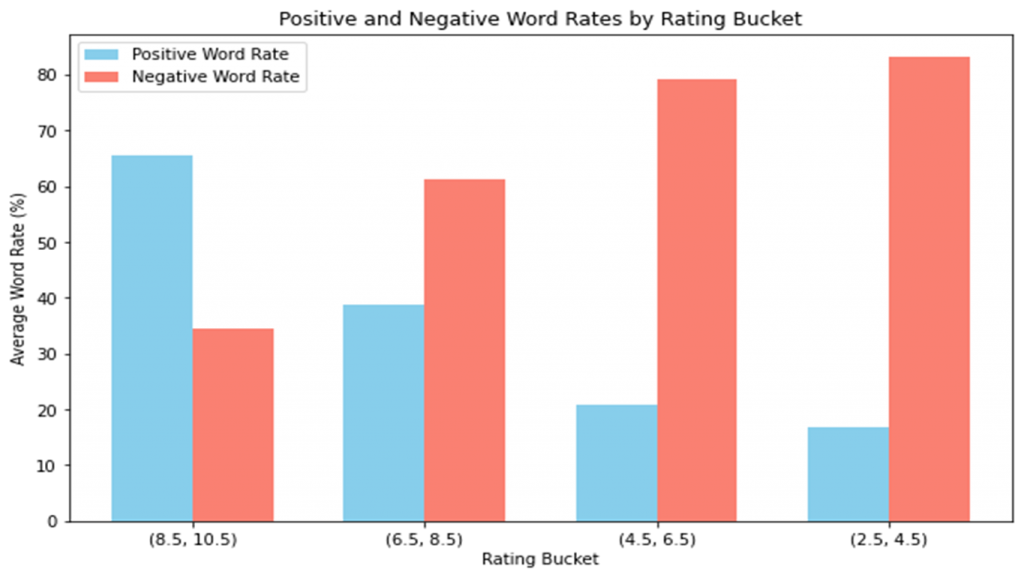
As we can see most of the ratings of the data set are high between 8.5 and 10.
We can also see the higher the rating the more we have positive word rate and the lower the rating the more we have negative word rate.
Country-wise Analysis of Hotel and Reviewer Metrics
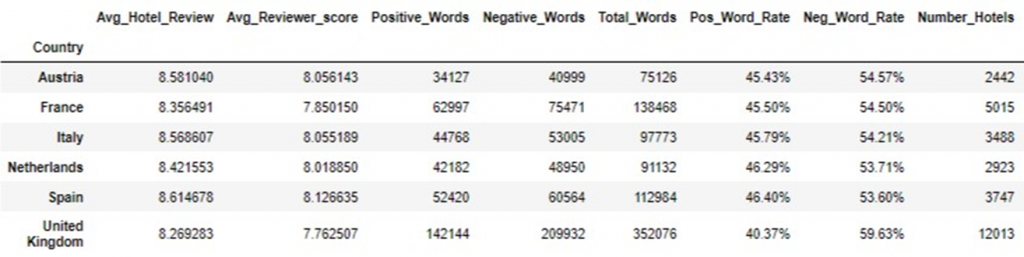
Here we are grouping the original data frame by the ‘Country’ column. For each group (which corresponds to a specific country), several summary statistics are calculated and organized into a new data frame. These statistics include the average hotel review score, the average reviewer score, the total count of positive and negative words in reviews, the total word count (sum of positive and negative words), the percentage of positive and negative words relative to the total word count, the number of hotels in each country, and the total number of reviews for each country.
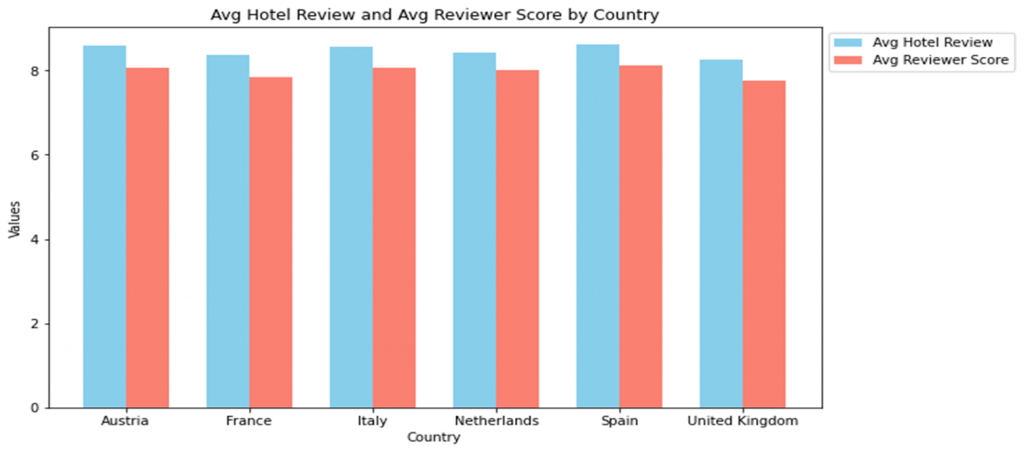
The average reviewer score is always lower than the average hotel score: This means that, in the data being analyzed, the average score given by reviewers (people who have stayed at hotels and provided scores) is consistently lower than the average score of the hotels themselves. In other words, on average, hotels rate themselves higher than the reviewers do.
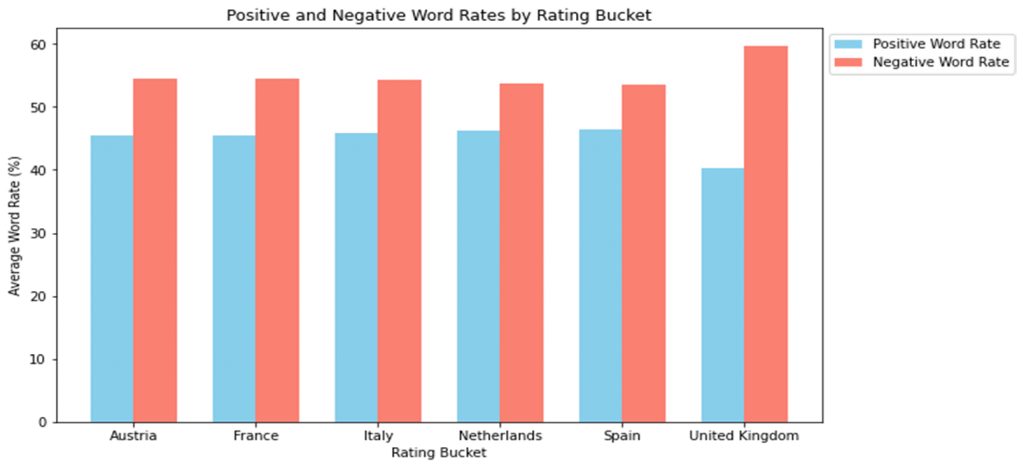
We also have more negative words rated than positive: This indicates that in the textual reviews or comments left by reviewers, there are more negative words (words indicating a negative experience or sentiment) than positive words (words indicating a positive experience or sentiment). It suggests that reviewers tend to use more negative language when describing their experiences.
Now, let’s visualize bigrams and trigrams for positive and negative reviews to understand what people like and dislike the most.
Review Analysis
Topic Modeling (LDA)
Latent Dirichlet Allocation (LDA) is a statistical model used for topic modeling and text analysis. It is particularly useful for uncovering the underlying structure or topics within a collection of documents or texts.
In simple terms, LDA helps identify the main themes or topics present in a large set of documents by analyzing the distribution of words in those documents.
We will start with fitting an LDA model on the negative reviews that returns 3 topics.
LDA for Negative Reviews
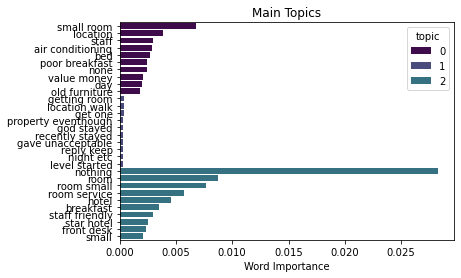
Some of the most popular topics are about room, location, AC, Staff, old furniture.
Analyzing Negative Reviews
Most of the negative reviews are about small room, room service and air conditioning problems.
These insights will be useful in helping hotels address some of the major issues that customers face.
We will use all this information to help hotels improve.
To do this we will create new columns in our data frame.
Those columns are room size, location, staff, air condition problems and old furniture.
If for each hotel we have more than 50% of negative reviews related to the above topics, we will consider it as a problem since 50% of reviewer said so.
For example if 50% of the reviews complained about the size of the room, we will signal it as a problem. Same for the others.
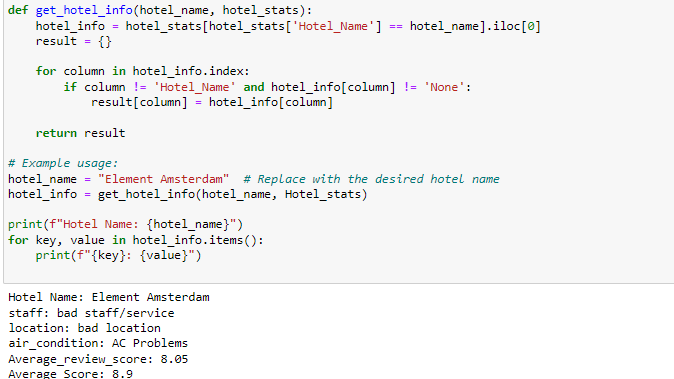
That’s the python code where we write the name of the hotel and see some of the most common negative comments that reviewer’s give.
The hotel name is « Element Amsterdam » and some of the most common reviews are bad staff, bad location, and Air conditioning problems.
LDA Model For Positive Reviews.
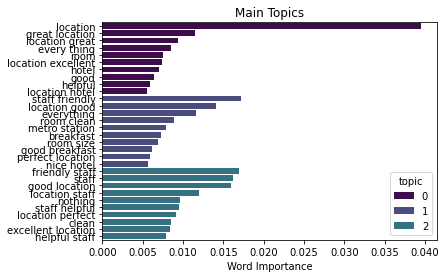
Most common topics are about staff , location, clean room and close to metro.
Analyzing Positive Reviews
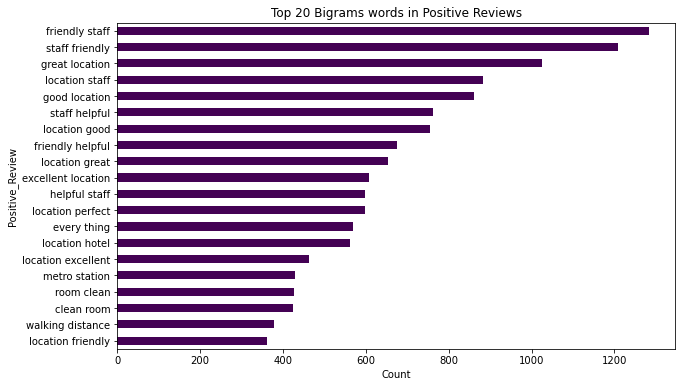
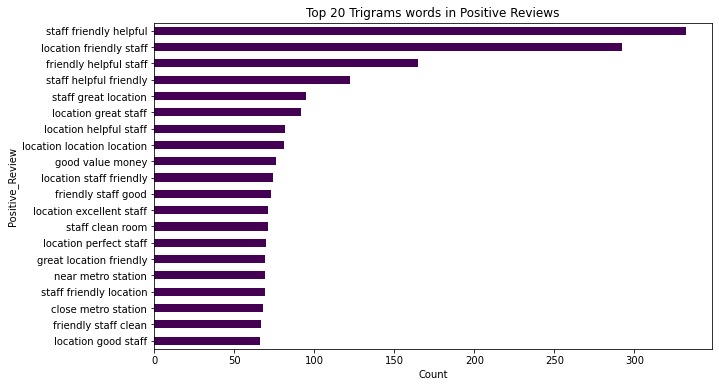
As we can see most of the positive reviews are about great location, great staff, clean room, near metro station.
Now for positive reviews we do the same as we did for negatives, we create new columns based on the information we extracted from positive reviews.
So we created these columns : clean room, great location, close to metro, great staff and if there’ a pool.
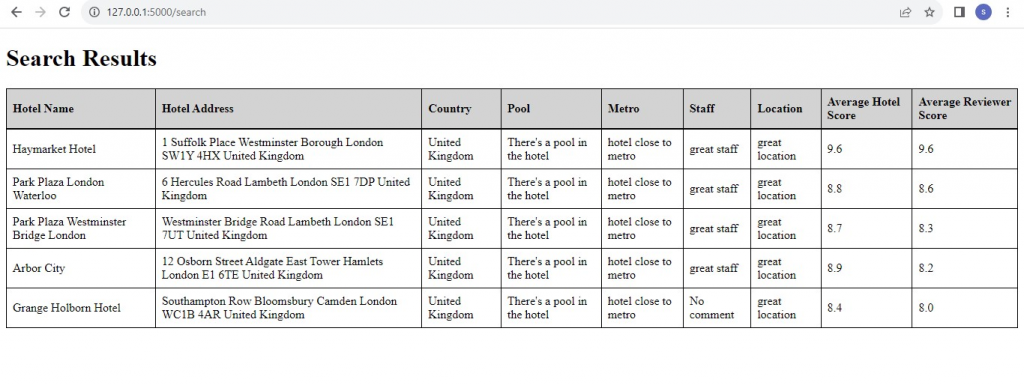
I did an application on flask where the user can write his recommended hotel based on which country he wants to travel to, if he wants a pool in the hotel, if he wants to be close to the metro, and the minimum hotel score he wants to go to.
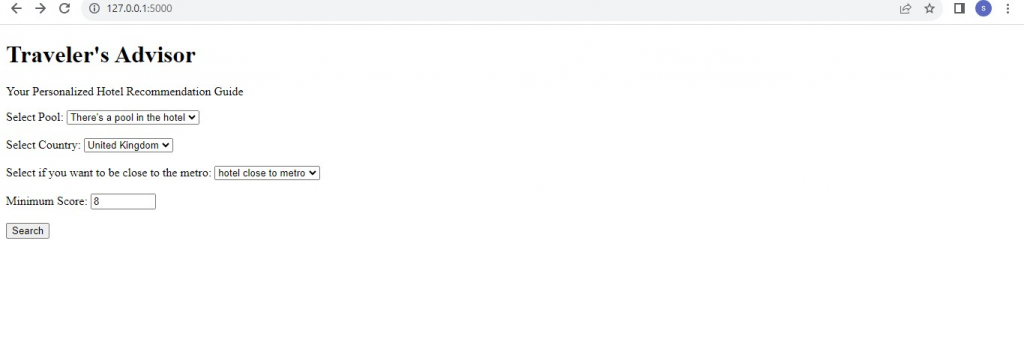
In the below picture we will get the recommended hotels with the most common reviews like if the location was good, if the staff or service was good based on previous comments.
Conclusion:
In this journey through the world of hospitality and traveler experiences, we’ve traversed the landscape of hotel reviews from Gulf tourists. The data has spoken, revealing invaluable insights for both the hospitality industry and wanderlust-driven explorers.
Our analysis showcased that Gulf tourists have a predilection for hotels in various countries, with the UK emerging as a favored destination. Their reviews, whether brimming with praises or constructive criticism, provide a wealth of information for hotels to enhance their services and for fellow travelers to make well-informed choices.
The power of Natural Language Processing (NLP) and topic modeling through LDA brought out hidden narratives within these reviews. From the most beloved attributes of hotels, such as « location » and « staff, » to the nuances like « room size » and « air conditioning, » we’ve uncovered what truly matters to travelers. These insights are a compass guiding hotels toward improvements and travelers to exceptional experiences.
As you embark on your future journeys and explore the world, may you carry these insights with you, making every travel experience a memorable one.
Thank you for joining us on this exploration.
What are your thoughts on this topic? We’d love to hear from you. Feel free to share your comments.
